超详细教程-第一次做数据可视化大屏
数据可视化大屏;手把手教程;小白入门
一、安装pyecharts
在pycharm都配置好的情况下,安装pyecharts
1.右键File–>Setting–>Project+(所创建的文件夹名称)–>Project Interpreter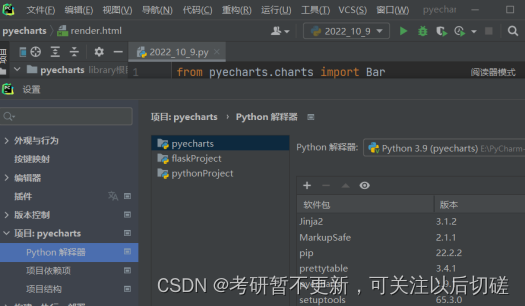
2.点击“+”,搜索pyecharts,然后安装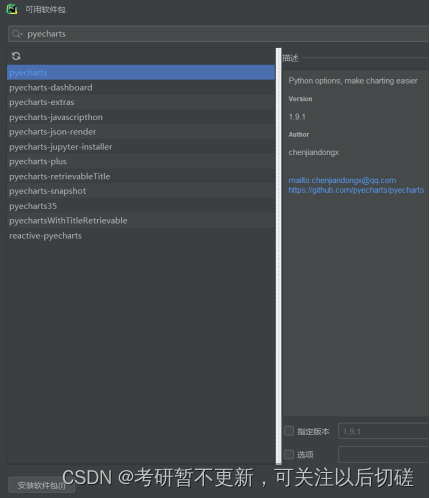
3.等进度条完成之后就说明安装完成了。
二、生成一个数据可视化大屏
代码来源:
https://zhuanlan.zhihu.com/p/383745843?utm_source=wechat_session&utm_medium=social&utm_oi=1171663036749746176&utm_campaign=shareopn
1.新建一个项目(我命名为pyecharts)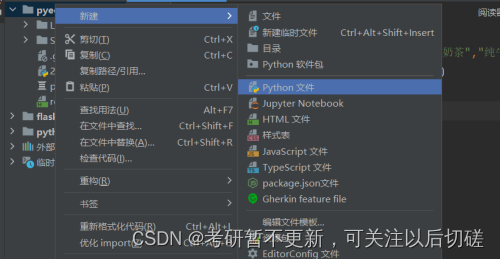
2.在所建的项目中新建一个python文件(我命名为2022_10_10)
3.右键文件名,运行下面的代码
from pyecharts import options as opts
from pyecharts.charts import Bar,Gauge,Pie,Page,Funnel,Geo,Scatter3D
import random

def bar(): #柱状图
    cate = ['1月', '2月', '3月', '4月', '5月', '6月']
    c = (
         Bar()
            .add_xaxis(cate)
            .add_yaxis("订单数", [random.randint(100, 200) for _ in cate])
            .add_yaxis("完成数", [random.randint(50, 100) for _ in cate])
            .set_series_opts(
                             label_opts=opts.LabelOpts(is_show=True,color="#2CB34A")

            )
            .set_global_opts(title_opts=opts.TitleOpts(title="2021年订单推移图",
                                                       title_textstyle_opts=opts.TextStyleOpts(color="#2CB34A"),
                                                       pos_left="5%"),
                             legend_opts=opts.LegendOpts(textstyle_opts=opts.TextStyleOpts(color="#2CB34A")),
                             xaxis_opts=opts.AxisOpts(axislabel_opts=opts.LabelOpts(color="#2CB34A")),
                             yaxis_opts=opts.AxisOpts(axislabel_opts=opts.LabelOpts(color="#2CB34A"))

            )
            .set_colors(["blue", "green"])
            #.render("bar_stack0.html")
    )
    return c

def tab0(name,color): #标题
    c = (Pie().
        set_global_opts(
        title_opts=opts.TitleOpts(title=name,pos_left='center',pos_top='center',
                                title_textstyle_opts=opts.TextStyleOpts(color=color,font_size=20))))
    return c

def tab1(name,color): #标题
    c = (Pie().
        set_global_opts(
        title_opts=opts.TitleOpts(title=name,pos_left='center',pos_top='center',
                                title_textstyle_opts=opts.TextStyleOpts(color=color,font_size=25))))
    return c

def gau():#仪表图
    c = (
        Gauge(init_opts=opts.InitOpts(width="400px", height="400px"))
            .add(series_name="库位利用率", data_pair=[["", 90]])
            .set_global_opts(
            legend_opts=opts.LegendOpts(is_show=False),
            tooltip_opts=opts.TooltipOpts(is_show=True, formatter="{a} <br/>{b} : {c}%"),

        )
            #.render("gauge.html")
    )
    return c

def radius():
    cate = ['客户A', '客户B', '客户C', '客户D', '客户E', '其他客户']
    data = [153, 124, 107, 99, 89, 46]
    c=Pie()
    c.add('', [list(z) for z in zip(cate, data)],
            radius=["30%", "75%"],
            rosetype="radius")
    c.set_global_opts(title_opts=opts.TitleOpts(title="客户销售额占比", padding=[1,250],title_textstyle_opts=opts.TextStyleOpts(color="#FFFFFF")),
                      legend_opts=opts.LegendOpts(textstyle_opts=opts.TextStyleOpts(color="#FFFFFF"),type_="scroll",orient="vertical",pos_right="5%",pos_top="middle")
                      )
    c.set_series_opts(label_opts=opts.LabelOpts(formatter="{b}: {d}%"))
    c.set_colors(['red',"orange", "yellow", "green", "Cyan", "purple"])

    return c

def funnel():
    cate = ['访问', '注册', '加入购物车', '提交订单', '付款成功']
    data = [30398, 15230, 10045, 8109, 5698]
    c = Funnel()
    c.add("用户数", [list(z) for z in zip(cate, data)],
               sort_='ascending',
               label_opts=opts.LabelOpts(position="inside"))
    c.set_global_opts(title_opts=opts.TitleOpts(title=""))
    return c

def geo():
    city_num = [('武汉',105),('成都',70),('北京',99),
            ('西安',80),('杭州',60),('贵阳',34),
            ('上海',65),('深圳',54),('乌鲁木齐',76),
            ('哈尔滨',47),('兰州',56),('信阳',85)]
    start_end = [('宁波','成都'),('武汉','北京'),('武汉','西安'),
             ('长沙','杭州'),('武汉','贵阳'),('武汉','上海'),
             ('甘肃','深圳'),('北京','乌鲁木齐'),('上海','哈尔滨'),
             ('武汉','兰州'),('西藏','信阳')]
    c = Geo()
    c.add_schema(maptype='china',
                itemstyle_opts=opts.ItemStyleOpts(color='#323c48', border_color='white'))
    # 4.添加数据
    c.add('', data_pair=city_num, color='white')
    c.add('', data_pair=start_end, type_="lines",label_opts=opts.LabelOpts(is_show=False),
         effect_opts=opts.EffectOpts(symbol="arrow",
                                     color='gold',
                                     symbol_size=7))
    c.set_global_opts(
        title_opts = opts.TitleOpts(title=""))

    return c

def scatter3D():
    data = [(random.randint(0, 100), random.randint(0, 100), random.randint(0, 100)) for _ in range(80)]
    c = (Scatter3D()
            .add("", data)
            .set_global_opts(
              title_opts=opts.TitleOpts(""),
            )
        )
    return c

page = Page()
page.add(
         tab0("OFFICETOUCH","#2CB34A"),
         bar(),
         tab1("数据可视化大屏","#2CB34A"),
         gau(),
         radius(),
         funnel(),
         geo(),
         scatter3D()
         )
page.render("datacenter.html")
#os.system("scatter.html")

from bs4 import BeautifulSoup
with open("datacenter.html", "r+", encoding='utf-8') as html:
    html_bf = BeautifulSoup(html, 'lxml')
    divs = html_bf.select('.chart-container')
    divs[0]["style"] = "width:10%;height:10%;position:absolute;top:0;left:2%;"
    divs[1]["style"] = "width:40%;height:40%;position:absolute;top:12%;left:0;"
    divs[2]["style"] = "width:35%;height:10%;position:absolute;top:2%;left:30%;"
    divs[3]["style"] = "width:40%;height:40%;position:absolute;top:10%;left:28%;"
    divs[4]["style"] = "width:40%;height:35%;position:absolute;top:12%;left:55%;"
    divs[5]["style"] = "width:30%;height:35%;position:absolute;top:60%;left:2%;"
    divs[6]["style"] = "width:60%;height:50%;position:absolute;top:45%;left:15%;"
    divs[7]["style"] = "width:35%;height:40%;position:absolute;top:50%;left:60%;"
    body = html_bf.find("body")
    body["style"] = "background-image: url(bgd.jpg)"  # 背景颜色
    html_new = str(html_bf)
    html.seek(0, 0)
    html.truncate()
    html.write(html_new)
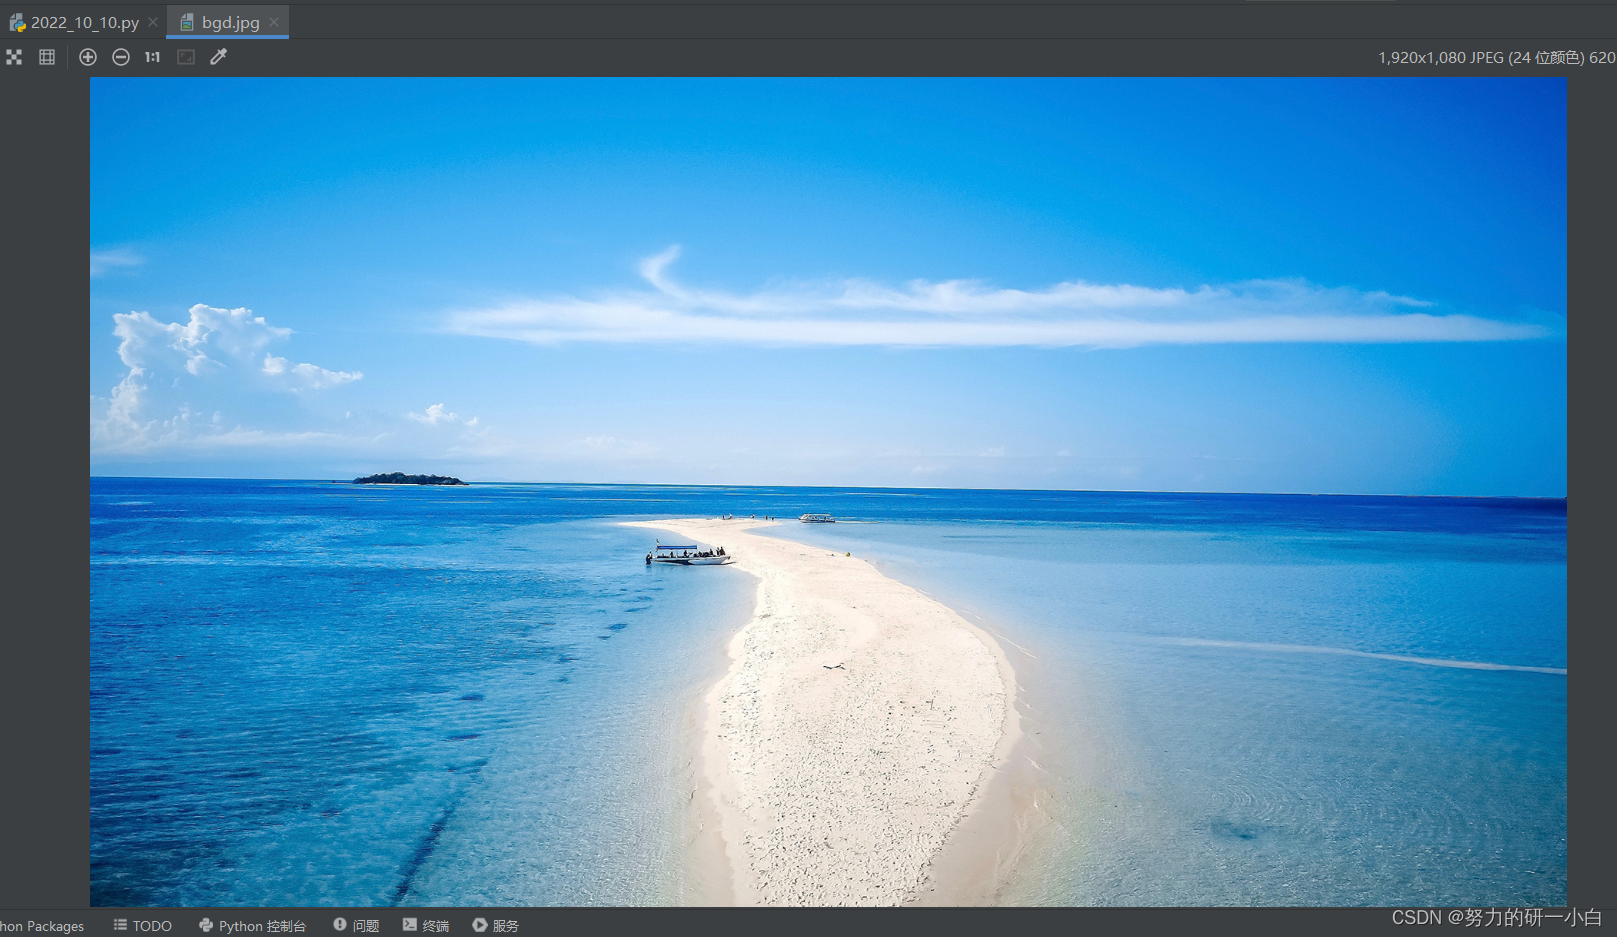
注:
body[“style”] = “background-image: url(bgd.jpg)”
需要自己在当前目录下放一张背景图片,命名为bgd.jpg。或者用其他的名字,需要在代码中做修改。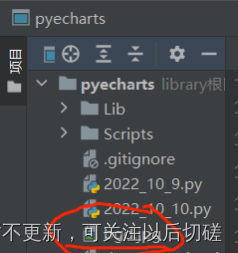
4.运行之后,会生成一个html的文件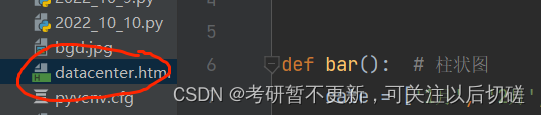
5.右键html文件,用浏览器打开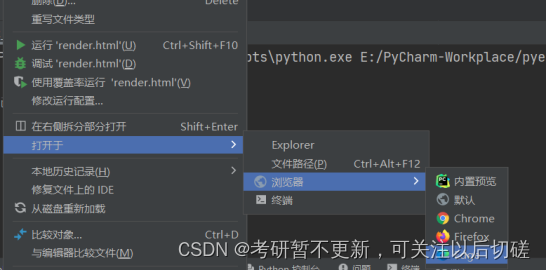
6.右键html文件,用浏览器打开,会生成如下

***注:***光有上面这些步骤,运行时是会报错的
1.调用beautifulsoup库时,运行后提示错误: ImportError: No module named bs4 , 意思就是没有找到bs4模块,所以解决方法就是将bs4安装上
具体步骤https://blog.csdn.net/liuxuejiao_/article/details/88028744
2.bs4解析网页时报错:
bs4.FeatureNotFound: Couldn’t find a tree builder with the features you requested: lxml. Do you need to install a parser library?
原因:不可以使用 BeautifulSoup(html,’lxml’) 没有找到lxml解析器
解决方法:https://blog.csdn.net/TestingRookie/article/details/107976677

永洪科技,致力于打造全球领先的数据技术厂商,具备从数据应用方案咨询、BI、AIGC智能分析、数字孪生、数据资产、数据治理、数据实施的端到端大数据价值服务能力。
更多推荐

 6
6 0
0- 0


 已为社区贡献1条内容

所有评论(0)