tb10_Tableau Prep_Extract_Group_Clean_Calculation_aggregation_Filter_Transform_Union_merge mismatch
We considered some options for structuring data in Tableau Desktop in the previous chapterhttps://blog.csdn.net/Linli522362242/article/details/123767628. Many of the concepts around well-structured da
We considered some options for structuring data in Tableau Desktop in the previous chapterhttps://blog.csdn.net/Linli522362242/article/details/123767628. Many of the concepts around well-structured data will apply here as we now turn our attention to a brand new product from Tableau: Tableau Prep. Tableau Prep extends the Tableau platform with robust options for cleaning and structuring data for analysis in Tableau. In the same way that Tableau Desktop provides a hands-on, visual experience for visualizing and analyzing data, Tableau Prep provides a hands-on, visual experience for cleaning and shaping data.
Tableau Prep is on an accelerated, monthly release cycle and while the platform continues to grow and expand, there is an underlying paradigm[ˈpærədaɪm]范例,样板 that sets a foundation for cleaning and shaping data. We'll cover a lot of ground in this chapter; however, our goal is not to cover every possible feature. Rather, we will seek to understand the underlying paradigm and flow of thought that will enable you to tackle a multitude of data challenges in Tableau Prep.
In this chapter, we'll work through a practical example as we explore the paradigm of Tableau Prep, understand the fundamental transformations, and see many of the features and functions of Tableau Prep.
We'll cover quite a few topics in this chapter, including the following:
- Understanding the Tableau Prep Builder Interface
- Flowing with the fundamental paradigm
- Using calculations and aggregations
- Filtering data
- Transforming data for custom analysis
- Options for automating flows
Warnings or important notes
In this chapter, we'll use the term Tableau Prep broadly to speak of the entire platform that Tableau has developed for data prep and sometimes as shorthand for Tableau Prep Builder, the client application that's used to connect to data, create data flows, and define output. Where needed for clarity[ˈklærəti]清晰易懂,思路清晰, we'll use these specific names:
- Tableau Prep Builder: The client application that's used to design data flows, run them locally, and publish them
- Tableau Prep Conductor: An add-on to Tableau Server that allows for the scheduling and automation of published data flows
Getting prepped[prept](使)准备好 to explore Tableau Prep
Tableau Prep Builder is available for Windows and Mac. If you do not currently have Tableau Prep Builder installed on your machine, please take a moment to download the application from https://www.tableau.com/products/prep/download. Licenses for Tableau Prep Builder are included with Tableau Creator licensing. If you do not currently have a license, you may trial the application for 14 days. Please speak with your Tableau representative to confirm licensing and trial periods.
The examples in this chapter use files that are located in the \Learning Tableau\Chapter 10 directory. Specific instructions will guide you on when and how to use the various files.
Understanding the Tableau Prep Builder Interface
You'll find a lot of similarities in the interfaces of Tableau Prep Builder and Tableau Desktop. The home screen of Tableau Prep Builder will look similar to this:
The following components have been numbered in the preceding screenshot:
- 1. The menu includes options for opening files, editing and running flows, signing into Tableau Server, and various Help functions.
- 2. The two large buttons at the top give you the option to Open a Flow to open an existing work or Connect to Data to start a new flow with an initial data connection. We'll define a flow in the next section. For now, think of a flow in terms of Tableau Prep's equivalent of a Tableau Desktop workbook.
- 3. Recent Flows shows the Tableau Prep data flows that you have recently saved. You may click on one of these to open the flow and edit or run it. A toggle button
 on the right allows you to switch between thumbnails and a list.
 - 4. Sample Flows allows you to open some prebuilt examples.
- 5. The Connections pane starts with a + button
 , allowing you to add a new data connection. As you add connections, they will be listed in this pane, along with associated tables, views, files, and other options.
 - 6. The Discover pane gives you options for training and resources as you learn more about Tableau Prep.
Once you have opened or started a new flow, the home screen will be replaced with a new interface that will facilitate designing and running flows:
This interface consists of the following, which are numbered in the preceding screenshot:
- 1. The Flow Pane, where you will logically build the flow of data with steps that will do anything from cleaning to calculation, to transformation and reshaping. Selecting any single step will reveal the rest of the interface that is specific to that step.
- 2. The Changes pane lists all of the changes that are made in the step, from calculations to renaming or removing fields, to changing data types or grouping values.
- 3. The Profile Pane gives you a profile of each field in the step. You are able to see the type and distribution of values for each field. Clicking on a field will highlight the lineage in the flow pane and clicking one or more values of a field using brushing will highlight the related values of other fields.
- 4. The Data Grid shows individual records of data as they exist in that step. Selecting a change in the Changes grid will show the data based on changes up to and including the selected change. Selecting a value in the profile pane will filter the Data Grid to only show records containing that value. For example, selecting First Class for the Ship Mode field in the profile pane will filter the data grid to show only records with a Ship Mode of First Class.
 This allows you to explore the data, but doesn't alter the data until you perform a specific action that does result in a change.
You will also notice the toolbar that allows you to undo or redo actions, refresh data, or run the flow. Additionally, there will be other options or controls that appear based on the type of step or field that's selected. We'll consider those details as we dive into the paradigm and practical example later.
Flowing with the fundamental paradigm
The overall paradigm of Tableau Prep is a hands-on, visual experience of discovering, cleaning, and shaping data through a flow. A flow (sometimes also called a data flow) is a logical series of steps and changes that are applied to data from input(s) to output(s). Here is what a flow looks like in the flow pane of Tableau Prep:
Each of the individual components of the flow are called steps, which are connected by lines that indicate the logical flow of data (left to right). The lines are called connectors or branches of the flow. Notice that the Aggregate Step here has one connector coming in from the left and three branches extending to the right. Any step can have multiple output branches, and each branch of a flow may end in a separate output or may be subsequently joined or unioned back into another part of the flow.
As we work through an example of a flow throughout this chapter, we'll examine each type of step more closely. For now, consider these preliminary[prɪˈlɪmɪneri]初步的 definitions of the primary steps in Tableau Prep:
- Input step
 : An input step starts the flow with data from file(s), table(s), view(s), or custom SQL. It gives options for defining file delimiters, unions of multiple tables or files, and how much data to sample (for larger record sets).
 - Clean step
 : A clean step allows you to perform a wide variety of functions on the data, including calculations, filtering, adjusting data types, removing and merging fields, grouping and cleaning, and much more.
 - Aggregate step
 : An aggregate step allows you to aggregate values (for example, get the MIN , MAX , SUM , AVG ) at a level of detail you specify.
 - Join step
 : A join step allows you to bring together 2 branches of the flow representing sets of data that can be joined on one or more key fields. You will have options for selecting the kind of join as well as the join fields.
- Union step
 : A union step allows you to bring together 2 or more branches representing sets of data to be unioned together. You will have options for merging or removing mismatched fields.
To perform a union, both datasets need to have almost the same layout/header
Tip- Both the Union Step and Join Step in this example have an error icon
 , indicating that something has not been configured correctly in the flow. Hovering over the icon gives a tooltip description of the error. In this case, the error is due to only having one input connection, while both the union and join require at least two inputs. Often, selecting a step with an error icon may reveal details about the error in the Changes pane or elsewhere in the configuration steps.
- Both the Union Step and Join Step in this example have an error icon
- Pivot step
 : A pivot step allows you to transform columns of data into rows or rows of data into columns. You'll have options to select the type of pivot as well as the fields themselves. Sometimes, you may hear the term transpose in place of pivot.https://blog.csdn.net/Linli522362242/article/details/123767628
 - Output step
 : The output step defines the ultimate destination for the cleaned and transformed data. This could be a text file ( .csv ), extract ( .hyper or .tde ), or published extracted data source to Tableau Server. You'll have options to select the type of output, along with the path and filename or Tableau Server and project.
Tip
Right-clicking a step or connector reveals various options. You may also drag and drop steps onto other steps to reveal options such as joining or unioning the steps together. If you want to replace an early part of the flow to swap out置換出 an input step, you can right-click the connector and select Remove, and then drag the new input step over the desired next step in the flow to add it as the new input.
In addition to using the term flow to refer to the steps and connections that define the logical flow and transformation of the data, we'll also use the term flow to refer to the file that Tableau Prep uses to store the definition of the steps and changes of a flow. Tableau Prep flow files have the .tfl (unpackaged flow) or .tflx (packaged flow, a compressed .zip file containing the .tfl file and extracts of the file-based data sources for the flow) extension.
The paradigm of Tableau Prep goes far beyond the features and capabilities of any single step. As you build and modify flows, you'll receive instant feedback so that you can see the impact of each step and change. This makes it relatively easy (and fun!) to iteratively discover your data and make the necessary changes.
Warnings or important notes
When you are building flows, adding steps, making changes, and interacting with data, you are in design mode. Tableau Prep uses a combination of the Hyper engine's cache, along with direct queries of the database, to provide near-instant feedback as you make changes. When you run a flow, you are using batch mode批处理模式. Tableau Prep will run optimized queries and operations that may be slightly different than the queries that are run in design mode.
We'll consider an example in the remainder of this chapter to aid in our discussion of the Tableau Prep paradigm and highlight some important features and considerations. The example will unfold organically, which will allow us to see how Tableau Prep gives you incredible flexibility to address data challenges as they arise and make changes as you discover new aspects of your data.
We'll put you in the role of an analyst at your organization, with the task of analyzing employee air travel. This will include ticket prices, airlines, and even a bit of geospatial[ˌdʒiəʊˈspeɪʃəl]地理空间的 analysis of the trips themselves. The data needs to be consolidated[kənˈsɑːlɪdeɪt]合并,统一 from multiple systems and will require some cleaning and shaping to enable the analysis.
Open Tableau Prep Builder and go to the home screen—we'll start by connecting to some data!
Connecting to data
Connecting to data in Tableau Prep is very similar to connecting to data in Tableau Desktop. From the home screen, you may click either Connect to Data![]() or the +
or the +![]() button on the expanded Connections pane:
button on the expanded Connections pane:
Tip
As with Tableau Desktop, for file-based data sources, you may drag the file from Windows Explorer or Finder onto the Tableau Prep window to quickly create a connection.
Tableau Prep supports dozens of file types and databases, and the list continues to grow. You'll recognize many of the same types of connection possibilities that exist in Tableau Desktop. However, at the time of writing this book, Tableau Prep does not support all of the connections that are available in Tableau Desktop.
You may create as many connections as you like and the Connections pane will list each connection separately with any associated files, tables, views, and stored procedures, or other options that are applicable to that data source. You will be able to use any combination of data sources in the flow.
For now, let's start our example with the following steps:
- 1. Click Connect to Data
 .
. - 2. From the expanded list of possible connections that appears, select Microsoft Excel.
Then Select Employee Flights.xlsx
- 3. You'll see a main table called Employee Flights and a subtable named Employee Flights Table 1. Drag the Employee Flights table to the Profile pane. An input step will be created, giving you a preview of the data and other options.

- 4. The input step displays a grid of fields and options for those fields. You'll notice that many of the fields in the Employee Flights table are named F2, F3, F4, and so on. This is due to the format of the Excel file, which has merged cells and a summary subtable. Check the Use Data Interpreter option on the Connections pane and Tableau Prep will correctly parse the file. It should look something like this:

When you select an input step, Tableau Prep will display a grid of fields in the data. You may use the grid to uncheck any fields you do not wish to include, edit the Type of data by clicking the associated symbol (for example, change a string to a date)
 , and edit the Field Name itself by double-clicking the field name value
 .
.
Warnings or important notes
If Tableau Prep Builder detects that the data source contains a large number of records, it may turn on data sampling. Data Sampling uses a smaller subset of records for giving rapid feedback and profiling in design mode. However, it will use the full set of data when you run the entire flow in batch mode. You can control the data sampling options by clicking Data Sample on the input pane. You'll receive an indicator of Data Sampling if it occurs anywhere in the flow.
Now, we'll continue to explore the data and fix some issues along the way. - 5. Click the + button
 on the right of the Employee Flights input step. This will extend the flow by Clicking a clean step called Clean 1.
- 6. Take a moment to explore the data using the Profile pane. Observe how selecting individual values for fields in the Profile pane highlights portions of related values for other fields. This can give you great insight into your data, such as seeing the different price ranges based on Ticket Type:

Highlighting the bar segments across fields in the Profile pane, which results from selecting a field value, is called brushing. You can also take action on selected values via the toolbar at the top of the profile pane or by right-clicking a field value. These actions include filtering , editing values, or replacing with null
 . However, before making any changes or cleaning any of the data, let's connect to some additional data.
It turns out that most of the airline ticket booking data is in one database that's represented by the Excel file, but another airline's booking data is stored in files that are periodically added to a directory. These files are in the \Learning Tableau\Chapter 10\ directory. The files are named with the convention Southwest YYYY.csv (where YYYY represents the year).
We'll connect to all of the existing files and ensure that we are prepared for additional future files:
- 1. Click the + icon on the Connections pane
 to add a new connection to a Text File.
 - 2. Navigate to the \Learning Tableau\Chapter 10\ directory and select any of the Southwest YYYY.csv files to start the connection. Looking at the Input settings, you should see that Tableau Prep correctly identifies the Field Separators, Field names, and Types:

- 3. In the Input pane,
 select the Multiple Files tab and switch from Single table to Wildcard通配符 union. Set the Matching Pattern to Southwest* and click Apply. This tells Tableau Prep to union all of text files in the directory that begin with Southwest together.
 - 4. Use the + icon on the Southwest input step in the flow pane to add a new step
 . This step will be named Clean 2 by default
 . Once again, explore the data, but don't take any action until you've brought the two sources together in the flow. You may notice a new field in the Clean 2 step called File Paths, which labels each record with the name of the applicable file from the Wildcard union.
Cleaning the data
The process of building out the flow is quite iterative and you'll often make discoveries about the data that will aid you in cleaning and transforming it. We'll break this example into sections for the sake of reference, but don't let this detract from the idea that building a flow should be a flow of thought. The example is meant to be seamless!
Union, merging mismatched fields, and removing unnecessary fields
We know that we want to bring together the booking data for all the airlines, so we'll union together the two paths in the flow:
- 1. Drag the Clean 2 step onto the Clean 1 step and drop it onto the Union box that appears. This will create a new Union step with input connections from both of the two clean steps:

- 2. The Union pane that shows up when the Union step is selected will show you the mismatched fields, indicate the associated input, and give you options for removing or merging the fields.
For example, Fare Type and Ticket Type are named differently between the Excel file and the text files, but indicate the same data. Hold down the Ctrl key and select both fields. Then, select Merge Fields from the toolbar at the top of the pane or from the right-click menu: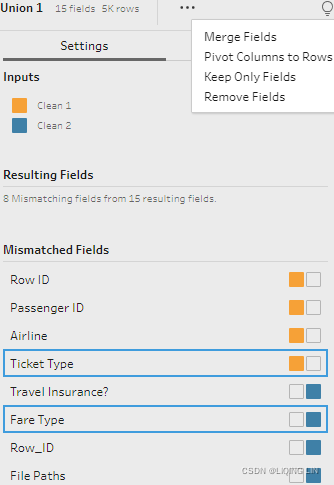
- 3. Also, merge Row ID and Row_ID.
- 4. File Paths applies only to the Southwest files, which were unioned together in the Input step. While this auto-generated field can be very useful at times, it does not add anything to the data in this example. Select the field and then click Remove Field from the menu.

- 5. Similarly, Travel Insurance? and Passenger ID apply to only one of the inputs and will be of little use in our analysis. Remove those fields as well.

- 6. The single remaining mismatched field, Airline, is useful. Leave it for now and click the + icon on the Union 1 step in the flow pane and extend the flow by selecting Add + Clean Step
 . At this point, your flow should look like this:
TIP
There is an icon above the Union 1 step in the flow, indicating changes that were made within this step. In this case, the changes are the removal of several of the fields. Each step with changes will have similar icons, which will reveal tooltip details when you hover over them and also allow you to interact with the changes. You can see a complete list of changes, edit them, reorder them, and remove them by clicking the step and opening the Changes pane. Depending on the step type, the Changes pane is available by either expanding it or selecting the Changes tab.
Grouping and cleaning
Now, we'll spend some time cleaning up the data that came from both input sources. With the Clean 3 step selected, use the Profile pane to examine the data and continue our flow. The first two fields indicate some issues that need to be addressed:
The Table Names field was generated by Tableau Prep as part of Union 1 to indicate the source of the records.
The Airline field came only from the Excel files (you can confirm this by selecting it in the profile pane and observing the highlighted path of the field in the flow pane). Click the null value for Airline and observe the brushing: this is proof that the NULL values in Airline all come from the Southwest files since those files did not contain a field to indicate the airline. We'll address处理 the NULL values and do some additional cleanup:
- 1. Double-click the null value
 and then type Southwest
 to replace(Click Enter key) NULL with the value you know represents the correct airline. Tableau Prep will indicate that a Group and Replace operation has occurred with a paperclip[ˈpeɪpəˌklɪp]回形针 icon
 .
. - 2. We'll do an additional grouping to clean up the variations of American. Using the Options button
 on the Airline field, select Group Values (OR Group and Replace) | Pronunciation:
==> Nearly all of the variations are grouped into the American Airlines value. Only AA remains.
 - 3. In the Group Values by Pronunciation(OR Group and Replace) pane that has appeared, hold Ctrl key then click AA and American Airlines, and then select Group Values:
 ==>
==> Click Done button
 - 4. Next, select the Table Names field, which is no longer needed. Using either the 4.
toolbar option, the menu from a right-click for the field, or the options button ,
,
select Remove Field.
- 5. the Profile pane have a Recommendations icon related to some fields in in the upper right corner
 .
.
Click Recommendations icon in the upper right corner of Passenger Email and then Apply the recommendation to assign a data role of email:
TIP
Data Roles allow you to quickly identify valid or invalid values according to what pattern or domain of values is expected. Once you have assigned a data role, you may receive additional recommendations to either Filter or Group Values(replace invalid values).
- 6. Click the Recommendations button
 again and Apply the option to Group Values ( Group and Replace invalid values) with NULL
- 7. Most of the remaining fields look fine, with the exception of Fare Type, which contains the values 1st Class and First Class. Select both of these values and then group them together with the First Class value.

- 8. At this point, we have a clean dataset that contains all of our primary data. There's already a lot of analysis we could do.
In fact, let's take a moment to preview the data. Right-click the Clean 3 step and select Preview in Tableau Desktop: ==>Click Done
 ==>
==>
A new data connection will be made and opened in Tableau Desktop. You can preview the data for any step in the flow. Take a few moments to explore the data in Tableau Desktop and then return to Tableau Prep. Now, we'll turn our attention to extending the dataset with some calculations, supplemental data, and a little restructuring.

Solution: see the following Tableau Extract-Step 4
Calculations and aggregations in Tableau Prep
Calculations in Tableau Prep follow a syntax that's nearly identical to Tableau Desktop. However, you'll notice that only row-level functions are available. This is because all of the calculations in Tableau Prep are done at a row level. Aggregations are performed using an aggregate step, which we'll consider shortly.
Calculations and aggregations can greatly extend our analytic capabilities. In our current example, there is an opportunity to analyze the length of time between ticket purchase and actual travel (DATEDIFF(' day' , [Purchase Date] , [Travel Date] ) ). We may also want to mark each record with an indicator of how frequently a passenger travels overall. Let's dive into these calculations as we continue our example with the following steps:
- 1. We'll start with a calculation to determine the length of time between purchase of tickets and the day of travel. Select the Clean 3 step and then
 click Create Calculated Field. Name the calculation Days from Purchase to Travel and enter
DATEDIFF('day', [Purchase Date], [Travel Date])
- 2. Examine the results in the Profile pane. The new field should look like this:
 The default view here (as in many cases with numeric fields) is a summary binned histogram(The shape of the data indicating what we might have expected with most people purchasing tickets closer (but not immediately before) to the date of travel. There might be some opportunity for getting better deals by purchasing more in advance, so identifying this pattern (and then exploring it more fully in Tableau Desktop) will be key to our analysis).
You can change the view to see its details by selecting the Options button in the upper right of the field and switching to Detail, which will show every value of the field:
The shape of the data that's indicated by the default Summary histogram is close to what we might have expected with most people purchasing tickets closer (but not immediately before) to the date of travel. There might be some opportunity for getting better deals by purchasing more in advance, so identifying this pattern (and then exploring it more fully in Tableau Desktop) will be key to our analysis.
We may also want to be able to group passengers based on how frequently they travel. We'll use some aggregations and calculations to accomplish this. - 3. Click the + icon
 that appears when you hover over the Clean 3 step and select Add Aggregate.
 A new step named Aggregate 1 will be added to the flow.
- 4. Double-click the text Aggregate 1 under the new step
 . This allows you to edit the name. Change the name from Aggregate 1 to Trips per person .
 - TIP
Give steps meaningful names to self-document the flow. This will greatly help you and others when you return to edit the flow in the future. Additionally, when you are editing the name of a step, the Add a description text will appear below the name. - Selecting the aggregate step reveals a pane with options for grouping and aggregating fields in the flow:

You may drag and drop fields from the left to the Grouped Fields or Aggregated Fields sections and you may change the type of aggregation by clicking on the aggregation text (for example, SUM) and selecting a different aggregation from the resulting dropdown. - Let's group by Person
 and and add Number of Rows to the Aggregated Fields as a SUM.
 Number of Rows is a special field that's available in the Aggregation step. We are using it here because every Person's record indicates an individual trip, so counting the records per person lets us know how many trips they've made. We'll use that information as we continue our example.
- 5. Click the + icon that appears when you hover over the Aggregate step Trips per person and select Add Step. A new step named Clean 4 to the flow.
 ==>
==>
- 6. Select this new Clean step and in the Profile pane, double-click the name of the Number of Rows field to rename it to Trips.

 ==>
==>
- 7. Create a new calculated field named Type of Traveler with the following code:
IF [Trips] > 15 THEN "Extreme"
ELSEIF [Trips] > 10 THEN "Frequent"
ELSEIF [Trips] > 4 Then "Casual"
END
This calculated field will now label each person as either an Extreme , Frequent , Casual , or Infrequent traveler, based on how many aggregate trips they've made.
At this point, you may notice that the flow only contains fields from the Aggregate step (plus the calculated field we just created): This is to be expected as Aggregate steps only retain either grouped or aggregated fields. At times, the results of aggregation are exactly what you want for analysis.
However, in this case, we wish to supplement[ˈsʌplɪmənt]增加,增补 the original dataset so that we can label each person as a certain type of traveler. We'll accomplish that next. - 8. Drag the Clean 4 step and hover over the Clean 3 step.
- 9.
 Drop the Clean 4 step onto the Join option that appears. allowing you to configure the join if needed.
  Note that Tableau Prep has automatically selected the most likely field for the join based on name and type:
Take a moment to examine the unique features of the Join pane:
- Applied Join Clauses[ˈklɔːzɪz]子句: Here, you have the option to add conditions to the Join clause and decide which fields should be used as keys to define the join. You may add as many clauses as you need.


- Join Type: Here, you may define the type of join (inner, left, left inner, right, right inner, or outer). Accomplish this by clicking sections of the Venn diagram to select or deselect the parts of the join you wish to retain.

- Summary of Join Results: The bar chart here indicates
- how many records come from each input of the flow and
- how many matched or did not match and
- whether they will be kept in the resulting dataset based on the type of join that's been selected.
- You may click a bar segment to see the filtered results in the data grid.

-
Join Clause Recommendations: If applicable, Tableau Prep will display probable Join Clauses可能的连接子句 which you can then add with a single click.
In our example, Tableau Prep automatically determined Person as a matching field between both join inputs and all values to find a match, as expected. No further action is required for this example, but in some cases you may need to adjust the Join Clauses or fix mismatched values.
TIP
Watch out for duplicate records that can be created as a result of an incorrect join. For example, you might expect a left join to retain all of the records on the left side and only match some of the records on the right. While that is true, records from the left side can be duplicated if they match more than one record on the right. Use the Summary of Join Results to watch out for unexpected results. Be aware that data sampling may also greatly impact the summary numbers.
Extend the flow by adding another clean step, which should be named Clean 5 automatically. At this point, the flow should look similar to this:
The results of joining an aggregation back to the original dataset is very similar to creating a
FIXED level of detail expression in Tableau Desktop. For example, in Tableau Desktop, we
might have written an expression such as the following:
{FIXED [Person] : SUM(1) }- Clean 4 step
 : to group passengers based on how frequently they travel.J
 - Join 1 step
 : to supplement[ˈsʌplɪmənt]增加,增补 the original dataset by joining outputs from Clean 3 step and Clean 4 step
{FIXED [Person] : SUM(1) } In Tableau Desktop, this expression gives the number of records at the level of Person and returns that value to every row. While LOD calculations cannot be written in the same way in Tableau Prep, we accomplished the same thing by aggregating and then joining back into
the flow.
We'll conclude our example by considering filtering and then reshaping the data for a very specific visual analysis.
Filtering in Tableau Prep
There are a few ways to filter in Tableau Prep:
- Filter an input
- Filter within the flow
Filtering an input can be efficient because the query that's sent to the data source will return fewer records. To filter an input, select the input step and then click the Filter Values... button on the input pane:
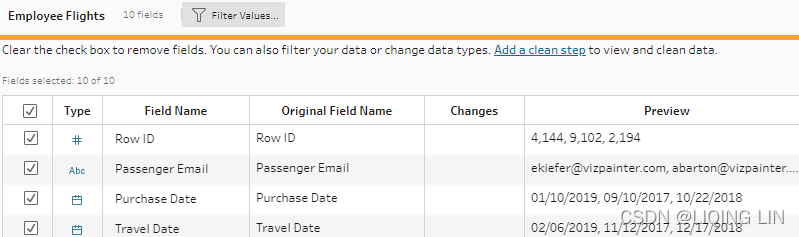
The Add Filter dialog that pops up allows you to write a calculation with a Boolean (true/false) result. Only true values will be retained.
Filtering may also be done within a clean step anywhere in the flow. There are several ways to apply a filter:
- Select one or more values for a given field and then use the Keep Only or Exclude options.

- Use the Option button
 on a field to reveal multiple filter options based on the field type.
For example, dates may be filtered by calculation, range, relative values, or Null values:
- Select a field and then Filter Values from the toolbar
 . Similar to the way filters work in the Input step, you will be prompted to write code that returns true for records you wish to retain.
If, for example, you wanted to keep records that had purchases on or after January 1, 2016, you could write code such as the following:[Purchase Date] > MAKEDATE(2016,1,1)
 ==>
==>
While no filtering is required for the dataset in our example, you may wish to experiment with various filtering techniques(if you applied the code to filter Purchase Date, please click Undo button![]() or click Delete button in Changes pane. ).
or click Delete button in Changes pane. ).
Transforming the data for analysis
At this point, we have a very useful dataset for analysis in Tableau Desktop, but there's a bit of additional transformation we might want to employ[ɪmˈplɔɪ]使用,利用. What if we wanted to render the flight paths in this dataset on a map? One approach in Tableau Desktop requires a dataset with 2 records per path:
- a record with latitude and longitude for an origin point and
- a separate record with latitude and longitude for a destination point.
Our dataset currently contains a single record for the path. We have a field named Route that contains values such as DAL-PHX and DFW-JFK. These pairs of values give us the origin airport code and destination airport code. With a bit of supplemental data and a transformation of the data, we can end up with data in a shape that allows us to visualize the path between the airports.
Conclude this chapter's example with the following steps:
- 1. Locate the Route field in the Clean 5 step and select it.

- 2. With the Route field selected, click Automatic Split on the pane's toolbar. The results are shown here:
 The Automatic Split evaluates the field and attempts to split based on a common delimiter. In this case, the dash(-) was identified as a likely delimiter of values and the Automatic Split results in two additional fields.
- TIP
The Search box in the upper right of the profile pane allows you to quickly find fields in the profile pane. Typing route in the preceding example finds the original Route field as well as the two split fields.
- TIP
- 3. Rename Route - Split 1(double click its text then click Enter key, or right click it then select Rename Field
 and click Enter key Finally) and Route - Split 2 as Origin and Destination, respectively.
We still have both the origin and destination in the same record, and our goal is to have a record for the origin and another record for the destination. Fortunately, Tableau Prep makes it easy to reshape the data from columns into rows (or, if needed, rows into columns). You'll accomplish this with a pivot. - 4. Using the + icon on the Clean 5 step, select Add Pivot
 .
.
- 5. The pivot pane gives you options for transforming rows into columns or columns into rows(Based on 2 columns or 2 feature values of a record, covert one record to 2 rows). We'll keep the default option. Drag both the Origin and Destination fields into the Pivot 1 Values area of the Pivoted Fields pane:
 Warnings or important notes
For columns to rows, the Pivot Values will be a column containing all of the values for the pivoted fields( here are Origin and Destination fields). The Pivot Names will be a column containing the name of the original column(field name, such as Destination). - 6. Double-click the text for Pivot 1 Values and rename the field to Airport Code. This field will contain all the airport codes for both origin and destination records.
- 7. Double-click the text for Pivot 1 Names and rename the field to Route Point. This field will label each record as either an Origin or Destination.

At this point, we have a dataset that contains a single record for each endpoint of the trip (either an origin or destination).
TIP
Notice that the pivot resulted in duplicate data. What was once one field (origin and destination together) is now two fields. The record count has doubled, so we can no longer count the number of records to determine the number of trips. We also cannot SUM the cost of a ticket as it will double count the ticket. We'll need to use MIN / MAX / AVG or some kind of level of detail expression or filter to look at only origins or destinations. While many transformations allow us to accomplish certain goals, we have to be aware that they may introduce other complications.
Tableau Extract
The only location information we currently have is an airport code. While Tableau Desktop contains geocoding for airport codes, we'll supplement our data with actual latitude and longitude values for each point:
- 1. Add a new data connection, selecting Tableau Extract as the type
 .
. 
- 2. Locate and select US Airports.hyper in the \Learning Tableau\Chapter 10 directory. This file contains geocoding(longitude and latitude) for many US airport codes.

- 3. The input step should be added automatically as the extract contains only one table of data. Drag this new input
 into the Pivot 1 step
 and drop it on the Join option
 . Tableau Prep will create a new join step
 and should automatically detect Airport Code as the field that matches between the two sides of the join.
- 4. Our dataset now contains all of the data that's required. Complete the flow by adding a final output.
 ==>
==> Set the type to .csv
 , browse to the \Learning Tableau\Chapter 10 directory, and give the file the name Employee Flights.csv.
 ==>
==> ==>
==> ==>
==>
Warnings or important notes
The output steps may be configured to publish the resulting data as a Tableau Server data connection or to output this to a file of type .csv(can be open by any version of Tableau Desktop) , .tde (Tableau Data Extract), or .hyper (Hyper data extract, can be open by the corresponding version or upper version of Tableau Desktop).
Note: because I use Tableau Pre Build trial and I need Origin field(which is existing in Clean 5 Step ) for some operations when I work on Tableau Desktop, so I append an Output Step (named Clean 5_output) after Clean 5 Step, then
  ==> run
  ==>
==>![]()

Now, you can run the flow by using the run button at the top of the toolbar or by clicking the run button  on the output step. Once the flow has been executed, open the Employee Travel.twb workbook in the \Learning Tableau\Chapter 10 directory to see how the data might be used and to explore it on your own:


 ==>
==> Route Point. This field labels each record as either an Origin or Destination

TIP
Unlike .tde or .hyper files, .csv files may be written to, even if they are open as a data source in Tableau Desktop. You will receive an error if you run a flow that attempts to overwrite a .tde or .hyper file that is in use. Additionally, you may rearrange the field order for a .csv file by dragging and dropping fields into the profile pane of a clean step prior to the output.
Options for automating flows
Tableau Prep Builder allows you to design and run flows using the application. Sometimes, data cleansing and prepping will be a one-time operation to support an ad hoc(Ad hoc临时计算 calculations allow you to add calculated fields to shelves in a single view without adding fields to the data pane.https://blog.csdn.net/Linli522362242/article/details/123188872 ) analysis. However, you will often want to run a flow subsequently to capture new or changed data and to cleanse and shape it according to the same pattern. In these cases, you'll want to consider some options for automating the flow:
- Tableau Prep Builder may be run via a command line. You may supply JSON files to define credentials for input or output data connections. This enables you to use scripting and scheduling utilities to run the flow without manually opening and running the Tableau Prep interface. Details on this option are available from Tableau Help: https://help.tableau.com/current/prep/en-us/prep_save_share.htm#refresh-output-files-from-the-command-lineand https://help.tableau.com/current/prep/en-us/prep_run_commandline.htm .
- Tableau Prep Conductor, an add-on to Tableau Server, gives you the ability to publish entire flows from Tableau Prep Builder to Tableau Server and then either run them on demand or on a custom schedule. It also provides monitoring and troubleshooting capabilities.
Summary
Tableau Prep's innovative paradigm of hands-on data cleansing and shaping with instant feedback greatly extends the Tableau platform and gives you incredible control over your data. In this chapter, we considered the overall interface and how it allows you to iteratively and rapidly build out a logical flow to clean and shape data for the desired analysis or visualization.
Through an intricate, yet practical, example that was woven throughout this chapter, we explored every major transformation in Tableau Prep, from inputs to unions, joins, aggregates and pivots, to outputs. Along the way, we also examined other transformations and capabilities such as calculations, splits, merges, and grouping of values. This gives you a foundation for molding[ˈmoʊldɪŋ] 塑造,模塑 and shaping data in any way you need.
In the next chapter, we'll once again return to Tableau Desktop to explore some advanced techniques and visualization types!

永洪科技,致力于打造全球领先的数据技术厂商,具备从数据应用方案咨询、BI、AIGC智能分析、数字孪生、数据资产、数据治理、数据实施的端到端大数据价值服务能力。
更多推荐
 1
1 0
0- 0


 已为社区贡献6条内容

所有评论(0)