如何在Power BI中建立动态等级图示?
现需要建立一个图示,根据用户的筛选展示相对应的下级数据。譬如筛选GrandParent就显示Parent 1和Parent 2的数据,筛选Parent 1就显示Child 1-1 和Child 1-2的数据。它含有三级等级:GrandParent->Parent->Child。其中Child 1-1和Child 1-2从属于Parent 1,其他从属于Parent 2。然后我们需要告诉Power
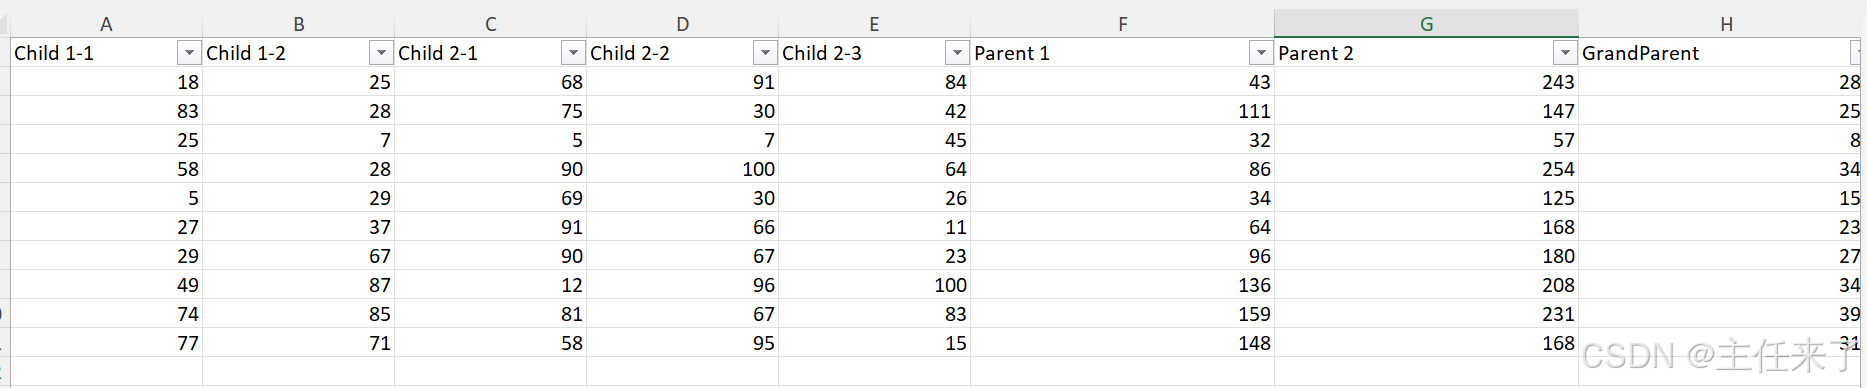
假设有一个表格:
https://github.com/checkming00/Medium_datasets/blob/main/data.xlsx
它含有三级等级:GrandParent->Parent->Child。其中Child 1-1和Child 1-2从属于Parent 1,其他从属于Parent 2。
现需要建立一个图示,根据用户的筛选展示相对应的下级数据。譬如筛选GrandParent就显示Parent 1和Parent 2的数据,筛选Parent 1就显示Child 1-1 和Child 1-2的数据。
这个数据结构是无法实现的,必须先做一些转换。
首先在Power BI中导入数据并打开Power Query。对所有列进行Unpivot columns的操作:

把第一列改名为"Lower"。
然后我们需要告诉Power BI,我们想要的等级是如何的。新增一个自定义列,并按照以下逻辑:

关闭并应用。
数据已经准备好,我们以Bar Chart为例建立图示。
选择Clustered Bar Chart,Lower放到Y坐标,Value放到X坐标:

此时图示显示所有内容,我们需要用一个筛选器来实现功能。
选择Slicer,把Higher作为数据,并激活单选。

功能已实现,可以根据需要做简单的美化。


可以看到,当用户筛选不同的等级时,图示会显示相对应的下级的数据。
感谢阅读。

永洪科技,致力于打造全球领先的数据技术厂商,具备从数据应用方案咨询、BI、AIGC智能分析、数字孪生、数据资产、数据治理、数据实施的端到端大数据价值服务能力。
更多推荐
 6
6 0
0- 0


 已为社区贡献3条内容

所有评论(0)