统计学习基础:数据挖掘、推理和预测_统计学习导论|读书笔记02|基础概念
统计学习(2.1) - 基础概念1. 预测推断和基础概念「Sales Example」Suppose we are consultants hired by a client to provide advice on how to improve sales of a particular product it is impossible for our clinet to directly in
统计学习(2.1) - 基础概念
1. 预测推断和基础概念
「Sales Example」
Suppose we are consultants hired by a client to provide advice on how to improve sales of a particular product
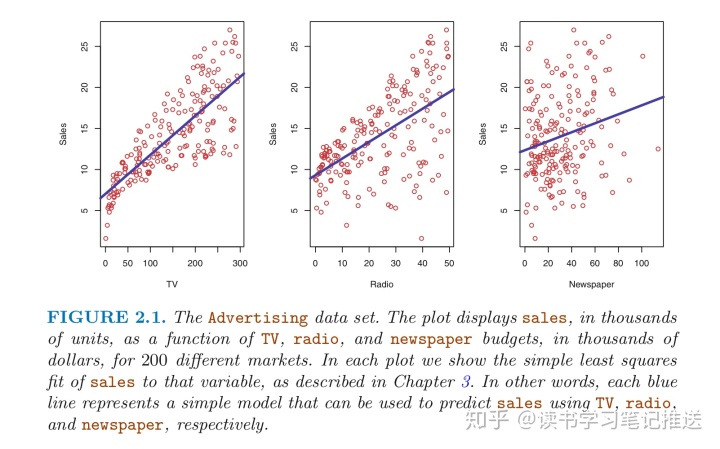
- it is impossible for our clinet to directly increase sales of the product
- Data analysis can help them to control the advertising expenditure in each of those three media
「Goal」
Develop an accurate model to predict sales on the basis of the three media budget
- indirectly increase
salesby adjusting advertising budgets
「Model and Variables」TV, radio and newspaper are three features, (or input & predictor)
- refer to the input vector collectively as
Sales is a response to predict
-
is a random error term, independent of
and has
zero
❝ In essence, statistical learning refers to a set of approaches for estimating![]()
❞
1.1 为什么估计
There are two main reasons:
「Prediction」
A set of inputs
-
represents our estimate for
, and
represents the resulting prediction for
-
「black box」, which means if it yields accurate predictions for
is treated as a
=> people not concerned with the exact form(inside) of
【月光宝盒】
- The accuracy of
(as prediction for
) depends on two quantities
- Reducible Error: can be reduced by using better statistical learning models
- Irreducible Error: variability associated with
affects the accuracy of our predictions, which is the error cannot be reduced
The average, or expected value of the squared difference between the predicted and actual value of
「Inference」
- need to be interpretable
- understand the way that
is affected as
change
-
cannot be treated as a black box
三个推断需要关注的问题
Q1: Which predictors are associated with the response?
- only a few predictors are important
Q2: What is the relationship between the response and each predictor?
- some may have a positive relationship and other may have a negative relationship with
Q3: Can the relationship between
- linear model may not provide an accurate representation of the relationship between the input and ouput variables (e.g. 深度神经网络 = 特殊的非线性回归分析方法)
Different methods for estimating
- 「Linear Models」 allow for relatively simple and 「interpretable inference」
- the highly non-linear approaches can provide quite 「accurate predicitions」 for
- but this comes at the expense of a less interpretable model for which inference is more challenging
1.2 如何估计
「Parametric Methods」
Two-step model-based approach:
- make an assumption about the functional form, or shape, of
. E.g. linear model
- after a model is selected, uses the training data to fit or train the model to estimate the parameters
- the approach to fitting the model is referred to as (ordinary) least squares
Parametric approach reduces the problem of estimating f down to one of estimating a set of parameters
- 通过估计一组参数来简化估计函数整体(整个黑盒子)
- 真实的世间万物的关系可不是线性模型
- disadvantage: the model we choose will never exactly match the unknown form of
- solution: Choosing 「flexible models」 that can fit many different possible functional forms of
- fitting a more flexible model requires estimating a greater number of parameters
- this can lead to a phenomenon known as 「overfitting」 the data, which means they follow the errors, or noise, to closely
Fit a linear model of the form
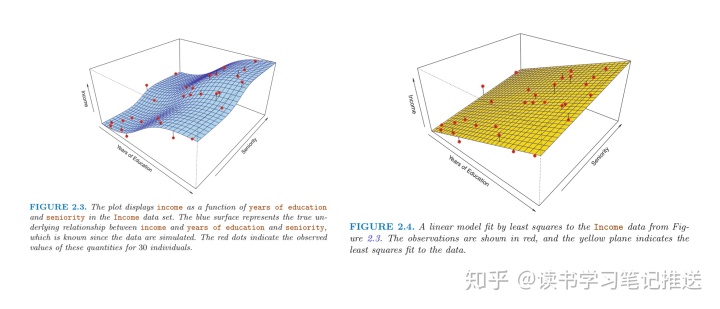
Comparing Figure 2.3 to Figure 2.4, the true
years of education and income
「Non-parametric Methods」
Do not make explicit assumptions about the functional form of
- seek an estimate of
as close to the data points as possible without being too rough or wiggly
that gets
- advantage: avoiding the assumption of a particular functional form of
- disadvantage: a large number of observations is required to obtain an accurate estimate for
- Thin-plate splines attempt to produce an estimate for
that is as close as possible to the observed data
- level of smoothness needs to be selected: lower level allows for a rougher fit (zero errors on the training data) but causes overfitting, choosing the correct amount of smoothness is in chapter 5.
1.3 预测准确性&模型解释性的权衡
Tradeoff: some models are less flexible (e.g. linear regression), or more restrictive(i.e. they can produce a relatively small range of shapes to estimate
- Thin plate splines are moreflexible since they can generate a much wider range of possible shapes to estimate
(complicated)
Q: Why would we choose restrictive method instead of a flexible one?
- when inference is the goal, linear model is easy to understand the relationship between Y and X
- however, flexible approaches like splines and the boosting methods(chapter 8) can lead to such complicated estimates of
that it is difficult to understand how any individual predictor is associated with the response
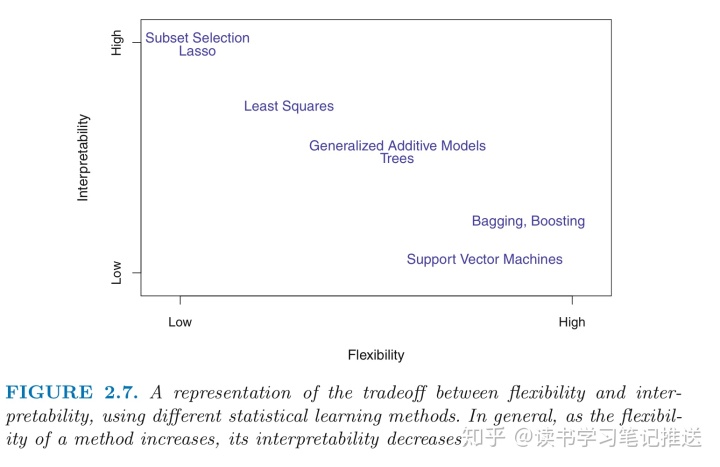
经验之谈(暂不知道原因,只做摘抄):
- Lasso uses a more restrictive procedure tin estimating the coefficients, and sets a number of them to Zero => more interpretable
- GAMs is less interpretable because the relationship between each X and Y is modeled using a non-linear curve
- Fully Non-Linear methods such as bagging, boosting and SVM with non-linear kernels are highly flexible but harder to interpret
- When Goal is inference, use simple and inflexible method
- When Goal is prediction, like predict the price of a stock, seems like to choose a flexible model
- even since our sole requirement is prediction accuracy, interpretability is not a concern
- however, still using a less flexible method to avoid overfitting in highly flexible methods
1.4 监督学习 & 无监督学习
「Supervised Learning」
Fit a model that relates the response for
- future observations (prediction)
- or better understanding between Y and X (inference)
- linear regression, logistic regression, GAM, boosting, SVM...
「Unsupervised Learning」
No associated response
- cluster analysis
- ascertain on the basis of
, whether the observations fall into relatively distinct groups
「Semi-supervised Learning」
For
- incorporate the
observations for which response measurements are available as well as the
observations for which they are not
1.5 回归问题 & 分类问题
Quantitative (take on numerical values) response
=> Regression Problem
- person's age, height, income, price of a stock
Qualitative (categorical, take on values in one of K classes) response => Classification Problem
- person's gender, brand of product
- whether a person defaults on a debt (yes or no)
Logistic Regression (chapter 4) is used with a qualitative (two-class, or binary) response
- classification method to estimates 「class probabilities」, this can be also thought of as a regression method
KNN(2.2) and Boosting (chapter 8) can be used in the case of either quantitative or qualitative responses
Since any qualitative predictors are properly 「coded」 before the analysis is performed
- most methods can be applied regardless of the predictor variable type
TOGO: 2.2. 评估模型精度

永洪科技,致力于打造全球领先的数据技术厂商,具备从数据应用方案咨询、BI、AIGC智能分析、数字孪生、数据资产、数据治理、数据实施的端到端大数据价值服务能力。
更多推荐


 0
0 0
0- 0


 已为社区贡献1条内容

所有评论(0)