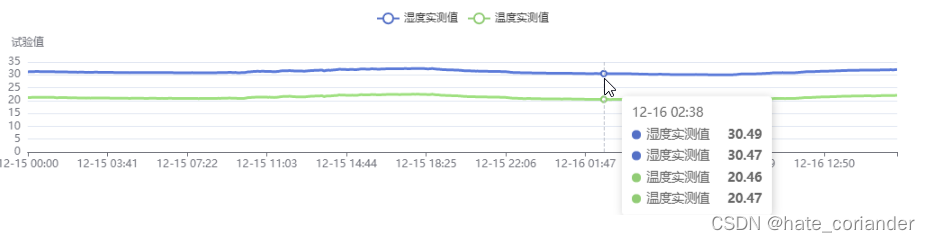
echarts温湿度实时数据展示
echarts温湿度实时数据展示<template><div><div id="chartt" class="chartt" :style="{ width: '100%', height: '230px' }"></div></div></template><script>import { getAction }
·
echarts温湿度实时数据展示
<template>
  <div>
    <div id="chartt" class="chartt" :style="{ width: '100%', height: '230px' }"></div>
  </div>
</template>

<script>
import { getAction } from '@api/manage'

export default {
  data() {
    return {
      url: {
        list: '/DaqBusiness/listAll',
      },
      chartsParams: []
    }
  },
  mounted() {
    getAction(this.url.list).then((res) => {
      if (res.code == 200) {
        /**
         * res = {
         *   code: 200,
         *   data: {
         *     data: [  //数据
         *       ["tagName", "tagValue", "TimeStamp"], //第一行数据为列标记数据
         *       ["Humidity_PV", "31.19", "12-15 00:00"],
         *       ["Humidity_PV", "32.06", "12-15 00:01"],
         *       ["Temperature_PV", "20.16", "12-16 05:01"],
         *       ...
         *     ],
         *     params: [ //需展示的几类数据定义
         *      {name: "湿度实测值", type: "Humidity_PV"},
         *      {name: "温度实测值", type: "Temperature_PV"}
         *     ]
         *   }
         * }
         */
        this.drawChart(res.data)
      }
    })
  },
  methods: {
    drawChart(record) {
      let myChart = this.$echarts.init(document.getElementById('chartt'))
      let myDataset = [];
      let mySeries = [];
      record.params.forEach(i => {
        myDataset.push(
          {
            id: i.type,
            fromDatasetId: 'dataset_raw',
            transform: {
              type: 'filter',
              config: {
                and: [
                  { dimension: 'tagName', '=': i.type }
                ]
              }
            }
          },
        );
        mySeries.push(
          {
            name: i.name,
            type: 'line',
            datasetId: i.type,
            showSymbol: false,
            encode: {
              x: 'TimeStamp',
              y: 'tagValue',
              itemName: 'TimeStamp',
              tooltip: ['tagValue']
            }
          },
        );
      });
      let option = {
        dataset: [
          {
            id: 'dataset_raw',
            source: record.data
          },
        ].concat(myDataset),
        title: {
          text: '规划曲线'
        },
        tooltip: {
          trigger: 'axis',
        },
        legend: {},
        xAxis: {
          type: 'category',
          nameLocation: 'middle',
        },
        yAxis: {
          name: '试验值'
        },
        series: mySeries
      };
      myChart.setOption(option)
      setTimeout(function () {
        window.onresize = function () {
          myChart.resize()
        }
      }, 200)
    },
  },
}
</script>
<style lang="less" scoped>
.chartt {
  width: 100%;
  height: 240px;
}
</style>

永洪科技,致力于打造全球领先的数据技术厂商,具备从数据应用方案咨询、BI、AIGC智能分析、数字孪生、数据资产、数据治理、数据实施的端到端大数据价值服务能力。
更多推荐

 0
0 0
0- 0


 已为社区贡献1条内容

所有评论(0)