【Python气象可视化】用Cartopy+Matplotlib绘制青藏高原涡移动轨迹图(附完整代码+颜色渐变时间轴)
摘要:本文介绍如何使用Python绘制青藏高原涡移动轨迹图。通过Cartopy库创建中国地图并添加地理特征(海岸线、边界等),利用Matplotlib绘制高原涡移动路径,用颜色渐变表示时间顺序。代码包含地图投影设置(PlateCarree中心经度105°)、青藏高原区域标注、轨迹可视化(线图+散点图)以及图例元素(指北针、比例尺、颜色条)的添加。该方案可直观展示高原涡在中国区域的移动轨迹,为气象研
·
使用Python绘制青藏高原涡(高原涡)的移动轨迹图。使用Python绘制青藏高原涡移动轨迹图。通过Cartopy库创建中国地图并添加地理特征(海岸线、边界等),利用Matplotlib绘制高原涡移动路径,用颜色渐变表示时间顺序。代码包含地图投影设置(PlateCarree中心经度105°)、青藏高原区域标注、轨迹可视化(线图+散点图)以及图例元素(指北针、比例尺、颜色条)的添加。该方案可直观展示高原涡在中国区域的移动轨迹,为气象研究提供可视化支持。
1. 导入库
import numpy as np import cartopy.crs as ccrs import cartopy.feature as cfeature
import matplotlib.pyplot as plt import matplotlib.font_manager as fm
import cartopy.mpl.ticker as ctickernumpy:用于数值计算,处理轨迹数据。cartopy:用于地理空间数据的可视化,支持地图投影和地理特征绘制。matplotlib:用于绘制图表。cartopy.mpl.ticker:提供地图坐标轴的格式化工具。
2. 设置中文字体
plt.rcParams['font.sans-serif'] = ['Microsoft YaHei', 'KaiTi', 'SimSun'] plt.rcParams['axes.unicode_minus'] = False- 确保图表中显示中文和负号(如“-”符号),避免乱码。
3. 创建中国地图基础函数
def create_china_map(ax, extent=[70, 140, 20, 45], spec=10):
    """创建中国区域基础地图"""
    ax.set_extent(extent, crs=ccrs.PlateCarree())  # 设置地图范围(经度70-140,纬度20-45)
    ax.add_feature(cfeature.COASTLINE.with_scale('50m'))  # 添加海岸线
    ax.add_feature(cfeature.BORDERS, linestyle=':')  # 添加国界线
    ax.add_feature(cfeature.LAKES, alpha=0.5)  # 添加湖泊
    ax.add_feature(cfeature.OCEAN, alpha=0.2)  # 添加海洋
    ax.add_feature(cfeature.LAND, alpha=0.1)  # 添加陆地
    provinces = cfeature.NaturalEarthFeature(...)  # 添加中国省级边界
    ax.add_feature(provinces)
# 设置坐标轴刻度、网格线等set_extent:定义地图显示区域(中国大部分地区)。add_feature:添加地理特征(如海岸线、湖泊、海洋等)。NaturalEarthFeature:使用自然地球数据集绘制中国省级边界。
4. 绘制高原涡轨迹图的函数
def plot_vortex_track(lons, lats):
    """绘制高原涡轨迹图并直接显示"""
    plt.figure(figsize=(14, 10))  # 设置画布大小
    ax = plt.axes(projection=ccrs.PlateCarree(central_longitude=105))  # 使用PlateCarree投影,中心经度105°
    create_china_map(ax)  # 调用函数绘制中国地图
    ax.add_patch(plt.Rectangle((73, 28), 32, 12, ...))  # 用矩形标注青藏高原区域
    ax.plot(lons, lats, 'b-', linewidth=2.5, ...)  # 绘制轨迹线
    scatter = ax.scatter(lons, lats, c=np.arange(len(lons)), cmap='viridis', ...)  # 绘制轨迹点
    plt.colorbar(scatter, ...)  # 添加颜色条
    plt.title('青藏高原涡移动轨迹', fontsize=16)  # 设置标题
    ax.text(...)  # 添加指北针、比例尺、标签
plt.show() # 显示图表PlateCarree(central_longitude=105):使用Plate Carree投影(等经纬度投影),中心经度105°(中国中部)。Rectangle:用矩形框标注青藏高原区域(经度73-105,纬度28-40)。plot和scatter:分别绘制轨迹线和轨迹点,cmap='viridis'表示颜色渐变。colorbar:颜色条显示轨迹点的顺序。- 指北针、比例尺、标签:通过
ax.text()添加文本说明。
5. 主程序(示例数据)
if __name__ == '__main__':
    lons = np.array([...])  # 示例经度数据(高原涡移动路径)
    lats = np.array([...])  # 示例纬度数据
plot_vortex_track(lons, lats) # 调用函数绘制轨迹图lons和lats:表示高原涡移动路径的经度和纬度坐标。plot_vortex_track:调用函数生成图表并直接显示。
6. 代码功能总结
- 地图绘制:使用Cartopy创建中国地图,并添加地理特征(海岸线、边界等)。
- 轨迹可视化:用线和点表示高原涡移动路径,颜色渐变表示时间顺序。
- 图例与标注:添加指北针、比例尺、颜色条和青藏高原区域标注。
# 高原涡轨迹图绘制 - 直接显示模式
import numpy as np
import cartopy.crs as ccrs
import cartopy.feature as cfeature
import matplotlib.pyplot as plt
import matplotlib.font_manager as fm
import cartopy.mpl.ticker as cticker
# 设置中文字体支持
plt.rcParams['font.sans-serif'] = ['Microsoft YaHei', 'KaiTi', 'SimSun'] # 稳定的中文字体
plt.rcParams['axes.unicode_minus'] = False # 正确显示负号
def create_china_map(ax, extent=[70, 140, 20, 45], spec=10):
"""创建中国区域基础地图"""
# 设置地图范围
ax.set_extent(extent, crs=ccrs.PlateCarree())
# 添加基础地理特征
ax.add_feature(cfeature.COASTLINE.with_scale('50m'))
ax.add_feature(cfeature.BORDERS, linestyle=':')
ax.add_feature(cfeature.LAKES, alpha=0.5)
ax.add_feature(cfeature.OCEAN, alpha=0.2)
ax.add_feature(cfeature.LAND, alpha=0.1)
# 添加中国省级边界
provinces = cfeature.NaturalEarthFeature(
category='cultural',
name='admin_1_states_provinces',
scale='50m',
facecolor='none',
edgecolor='gray',
linewidth=0.5
)
ax.add_feature(provinces)
# 设置坐标轴
ax.set_xticks(np.arange(extent[0], extent[1] + spec, spec), crs=ccrs.PlateCarree())
ax.set_yticks(np.arange(extent[2], extent[3] + spec, spec), crs=ccrs.PlateCarree())
lon_formatter = cticker.LongitudeFormatter()
lat_formatter = cticker.LatitudeFormatter()
ax.xaxis.set_major_formatter(lon_formatter)
ax.yaxis.set_major_formatter(lat_formatter)
ax.gridlines(linewidth=0.5, color='gray', alpha=0.5, linestyle='--')
def plot_vortex_track(lons, lats):
"""绘制高原涡轨迹图并直接显示"""
# 创建画布
plt.figure(figsize=(14, 10))
ax = plt.axes(projection=ccrs.PlateCarree(central_longitude=105))
# 创建地图
create_china_map(ax)
# 标记青藏高原区域
ax.add_patch(plt.Rectangle((73, 28), 32, 12,
linewidth=1.5, edgecolor='darkred',
facecolor='lightyellow', alpha=0.4,
transform=ccrs.PlateCarree()))
# 绘制轨迹线
ax.plot(lons, lats, 'b-', linewidth=2.5, transform=ccrs.PlateCarree())
# 标记点
scatter = ax.scatter(lons, lats, c=np.arange(len(lons)),
cmap='viridis', s=50, edgecolor='black',
transform=ccrs.PlateCarree())
# 添加颜色条
cbar = plt.colorbar(scatter, ax=ax, orientation='horizontal',
pad=0.05, label='轨迹点顺序')
# 设置中文标题
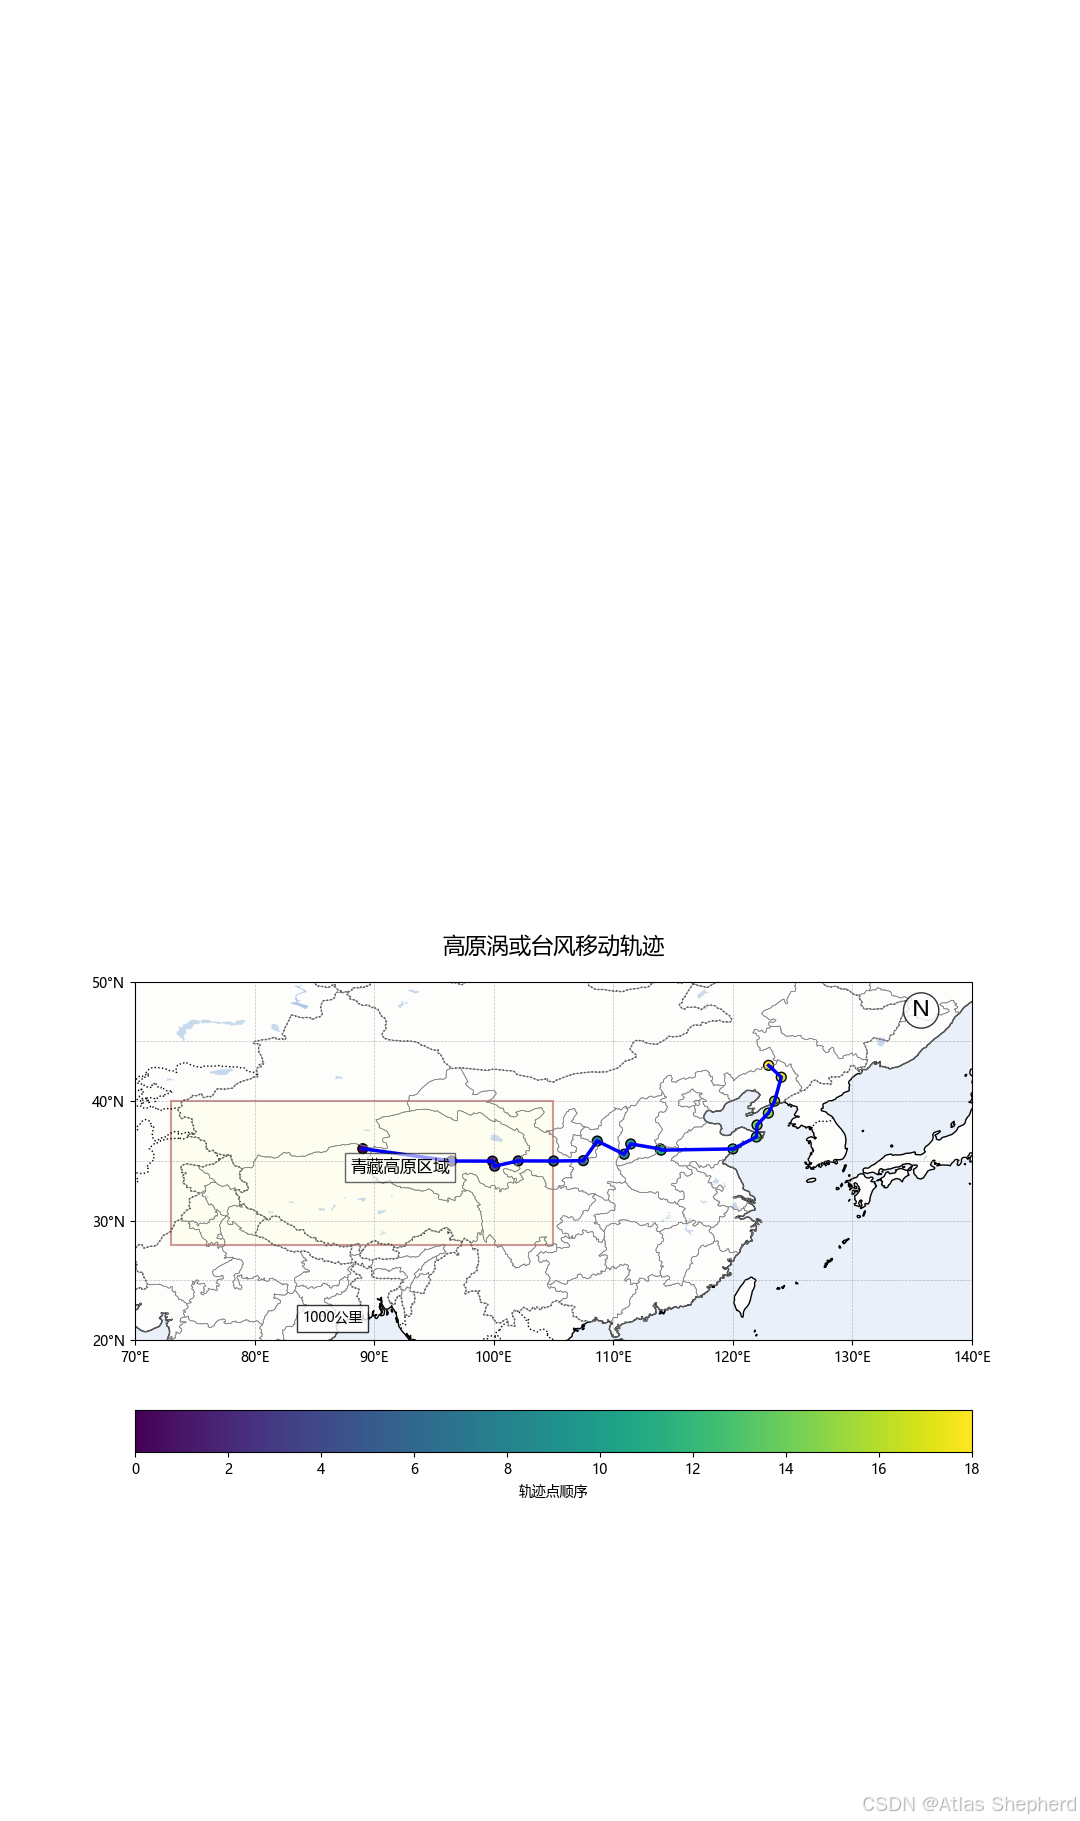
plt.title('高原涡或台风移动轨迹', fontsize=16, pad=20)
# 添加指北针
ax.text(0.95, 0.95, 'N', transform=ax.transAxes,
fontsize=16, va='top', ha='right',
bbox=dict(boxstyle='circle', facecolor='white', alpha=0.8))
# 添加比例尺
ax.text(0.2, 0.05, '1000公里', transform=ax.transAxes,
bbox=dict(facecolor='white', alpha=0.8))
# 添加青藏高原标签
ax.text(88, 34, '青藏高原区域', fontsize=12,
transform=ccrs.PlateCarree(),
bbox=dict(facecolor='white', alpha=0.6))
# 直接显示图像
plt.show()
if __name__ == '__main__':
# 高原涡轨迹数据
lons = np.array([89.05, 96.47, 99.89, 100.08, 102.05, 105.01, 107.49, 108.66,
110.91, 111.46, 113.93, 114.00, 120.00, 121.97, 122.02, 122.97,
123.49, 124.05, 122.99])
lats = np.array([36.02, 34.99, 34.98, 34.56, 35.00, 34.99, 35.02, 36.66,
35.56, 36.42, 36.00, 35.90, 36.00, 37.00, 38.00, 39.00,
40.00, 42.00, 42.99])
# 绘制并显示轨迹图
plot_vortex_track(lons, lats)

永洪科技,致力于打造全球领先的数据技术厂商,具备从数据应用方案咨询、BI、AIGC智能分析、数字孪生、数据资产、数据治理、数据实施的端到端大数据价值服务能力。
更多推荐


 9
9 0
0- 0


 已为社区贡献2条内容

所有评论(0)