数据分析-SQL数据分析实操
描述性分析、分组分析、结构分析、分布分析、交叉分析、矩阵分析、转化分析、RFM分析、留存分析、生命周期分析
描述性分析
![]()
知识点
描述性分析,也称描述性统计分析,它是对数据进行分析,得出反映客观现象的各种数量特征的一种分析方法,主要包括数据的集中趋势分析、离散程度分析、频数分布分析等,常用的统计指标有计数、求和、平均值、最小值、最大值、标准差、方差等。
MySQL中对应的函数分别为Count(计数)、Sum(求和)、Avg(平均值)、Min(最小值)、Max(最大值)、StdDev(标准差_英文全程standard deviation)、Variance(方差)。
select
	count(price) as count,
	sum(price) as sum,
	avg(price) as avg,
	min(price) as min,
	max(price) as max,
	stddev(price) as stdev,
	variance(price) as var
from item;
分组分析
简单分组统计
统计不同出版社商品的平均价格
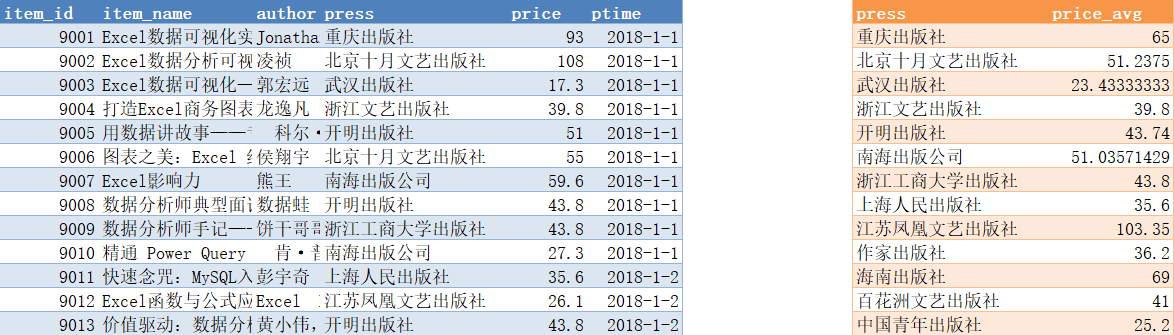
select
	press,
	avg(price) as price_avg
from item
group by press;
分组排序统计
知识点
MySQL数据框LIMIT用法
SELECT 字段
FROM 表
WHERE 过滤条件
GROUP BY 字段
ORDER BY 字段
LIMIT n
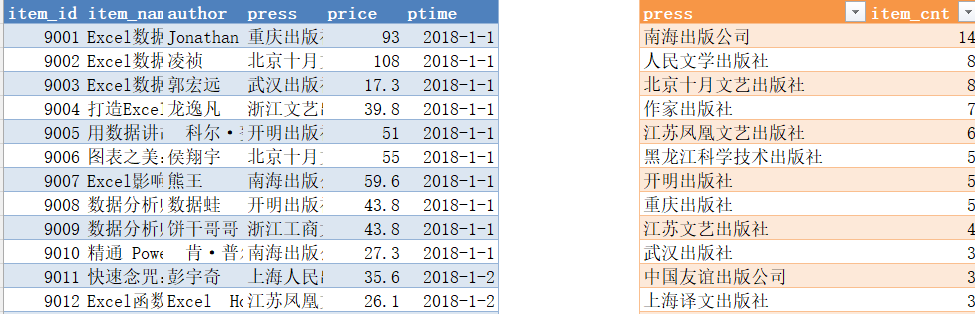
select
press,
count(item_id) as item_cnt
from item
group by press
order by count(item_id) desc;
-- 商品数前5的结果
select
press,
count(item_id) as item_cnt
from item
group by press
order by count(item_id) desc
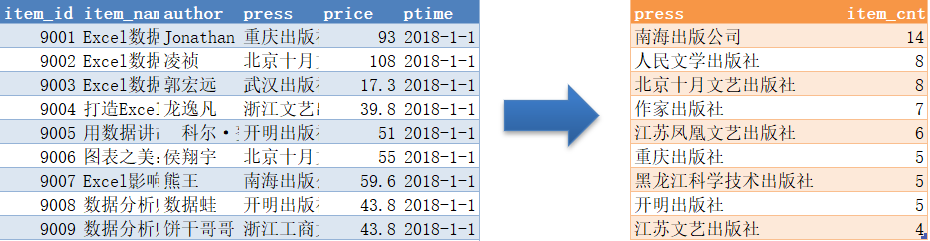
limit 5;分组过滤统计
出版社的商品数大于3的数据
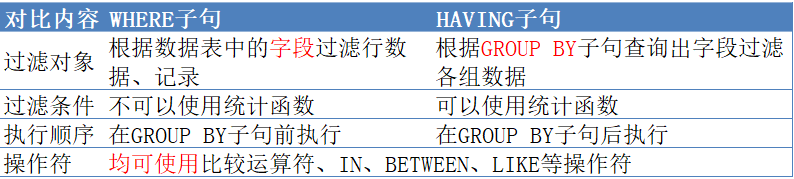
知识点
HAVING子句用法
SELECT 字段
FROM 表
WHERE 过滤条件
GROUP BY 字段
HAVING 条件
ORDER BY 字段
select
	press,
	count(item_id) as item_cnt
from item
group by press
having count(item_id) > 3
order by count(item_id) desc;
分组去重统计
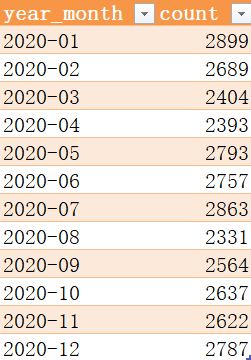
2020年每月登录用户数
关键技巧
1- 去重统计,Count(DISTINCT uid)
2- 日期转文本,Date_format(date,'%Y-%m')
3- GROUP BY子句中不能使用字段的别名,因为SELECT在GROUP BY之后执行,别名还未生效。
SQL执行顺序
FROM 表
JOIN ON
WHERE 过滤行条件
GROUP BY 字段
HAVING 过滤组条件
SELECT 字段
ORDER BY 字段
LIMIT
select
	date_format(date,'%Y-%m') as 'year_month',
	count(distinct uid) as count
from login
where `date` between '2020/1/1' and '2020/12/31'
group by date_format(date,'%Y-%m');
结构分析
简单结构分析
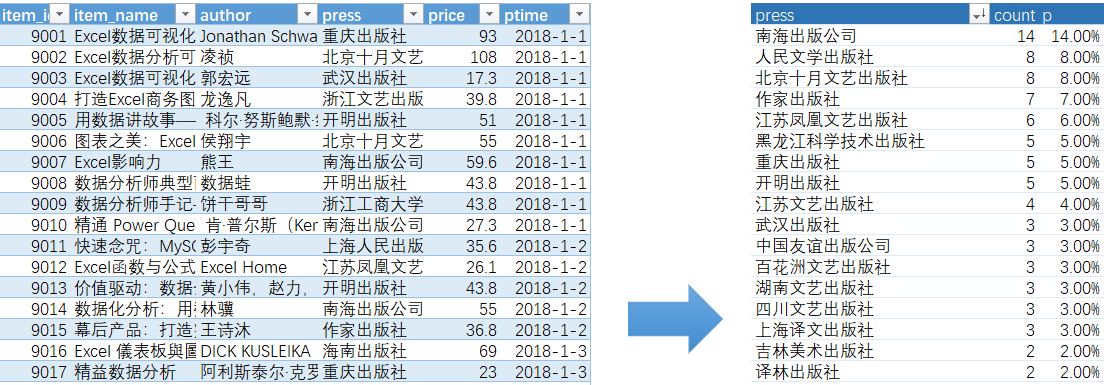
select
	press,
	count(item_id) as count,
	-- (select count(item_id) from item) as total,
	count(item_id)/(select count(item_id) from item) as p
from item
group by press
order by count(item_id) desc;
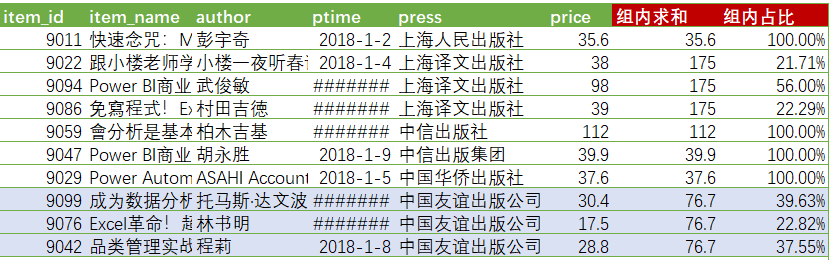
组内占比
知识点
窗口函数定义:
窗口函数(Windows Function)又叫分析函数(Analytic Function),可以像聚合函数一样对一组数据进行分析并返回结果,二者不同之处在于,窗口函数不是将一组数据汇总成单个结果,而是为每一行数据都返回一个结果。
窗口函数语法:
<窗口函数> OVER (
[PARTITION BY <用于分组的列>]
[ORDER BY <用于排序的列>]
[frame_clause<设定窗口大小>]
)
常用的窗口函数有:
SUM()、AVG()、COUNT()、MAX()、MIN()、
RANK()、DENSE_RANK()、ROW_NUMBER()等。
select
item.*,
sum(price) over (partition by press) as 组内求和,
(price / sum(price) over (partition by press)) as 组内占比,
rank() over (partition by press order by price desc) as 组内排名
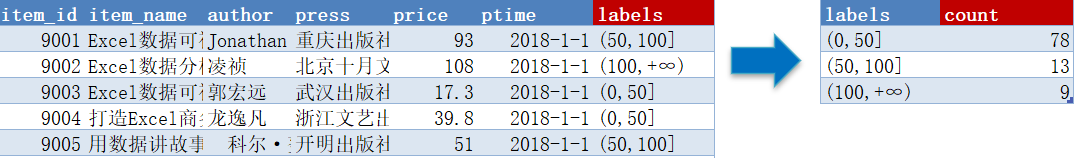
from item;分布分析
基于表item,新增字段labels,对“price”字段进行以50元、100元为区间临界值的价格段分组操作。
知识点
CASE语句用法
CASE
WHEN 条件表达式1 TEHN 结果1
……
WHEN 条件表达式n THEN 结果n
ELSE 其他结果
END
通用表表达式
Common Table Expression简称CTE,用于简化复杂的子查询和连接查询,提高SQL语句的可读性和性能。
with
临时表名称 as 子查询语句,
临时表名称 as 子查询语句,
…
-- case 语句
select
	case
		when price > 100 then '(100,+∞)'
		when price > 50 then '(50,100]'
		else '(0,50]'
	end as labels,
	count(item_id) as count
from item
group by
	case
		when price > 100 then '(100,+∞)'
		when price > 50 then '(50,100]'
		else '(0,50]'
	end;

-- 不是所有数据库都可以直接写成group by labels
select
	case
		when price > 100 then '(100,+∞)'
		when price > 50 then '(50,100]'
		else '(0,50]'
	end as labels,
	count(item_id) as count
from item
group by labels;

-- 临时表CTE
with a as
(
select
	item.*,
	case
		when price > 100 then '(100,+∞)'
		when price > 50 then '(50,100]'
		else '(0,50]'
	end as labels
from item
)

select
	labels,
	count(item_id) as count
from a
group by labels;
交叉分析
交叉分析1
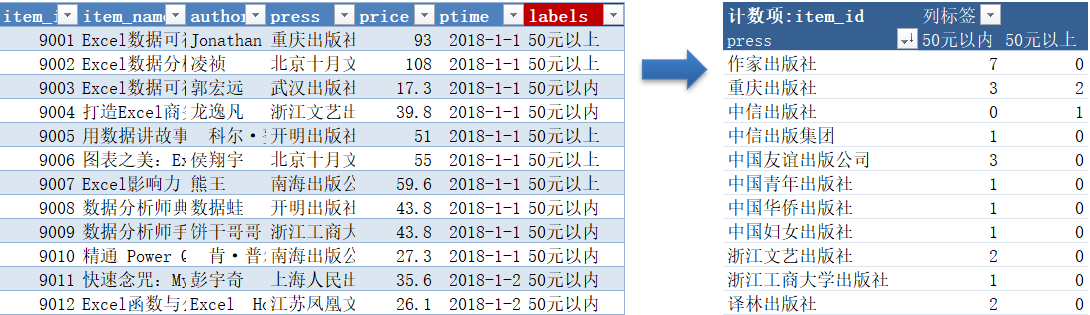
-- 写法一
with a as
(
select
	item.*,
	(case when price <= 50 then '50元以内' else null end) as '50元以内',
	(case when price > 50 then '50元以上' else null end) as '50元以上'
from item
)

select
	press,
	count(50元以内) as '50元以内',
	count(50元以上) as '50元以上'
from a
group by press;

-- 写法二
select
	press,
	count((case when price <= 50 then '50元以内' else null end)) as '50元以内',
	count((case when price > 50 then '50元以上' else null end)) as '50元以上'
from item
group by press;
交叉分析2
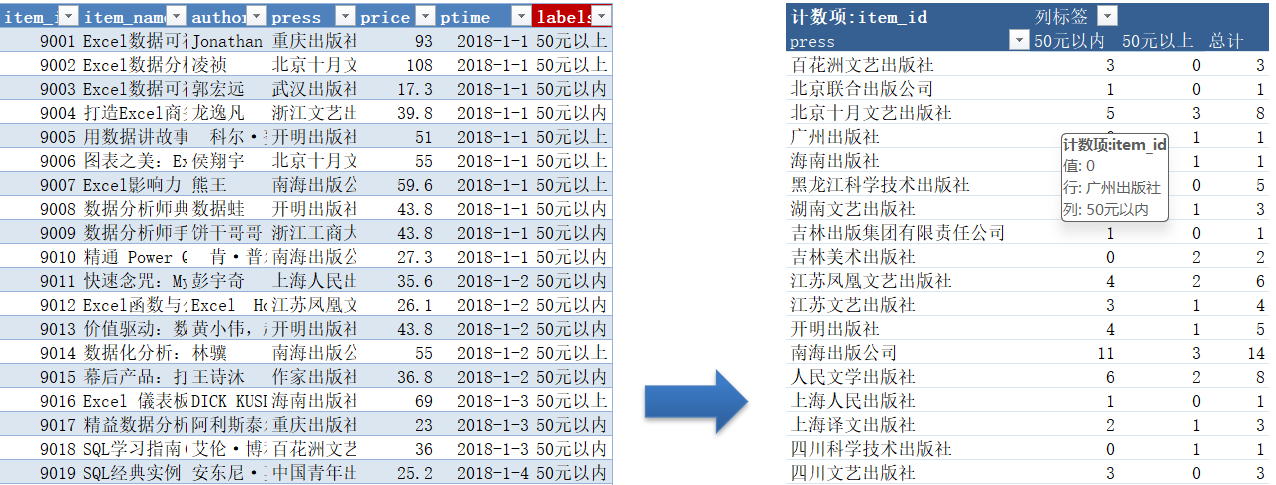
select
	press,
	count((case when price <= 50 then '50元以内' else null end)) as '50元以内',
	count((case when price > 50 then '50元以上' else null end)) as '50元以上',
	count(item_id) as 总计
from item
group by press;
一维表转二维表
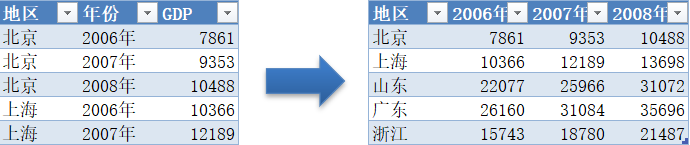
select
	地区,
	sum((case when 年份 = '2006年' then GDP else 0 end)) as '2006年',
	sum((case when 年份 = '2007年' then GDP else 0 end)) as '2007年',
	sum((case when 年份 = '2008年' then GDP else 0 end)) as '2008年'
from 一维表
group by 地区;
矩阵分析
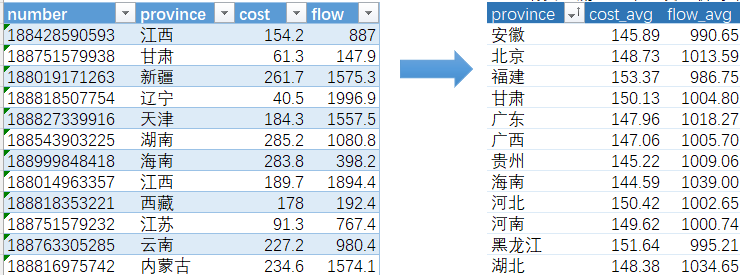
select
	province,
	avg(cost) as cost_avg,
	avg(flow) as flow_avg
from telecom
group by province
order by convert(province using gbk);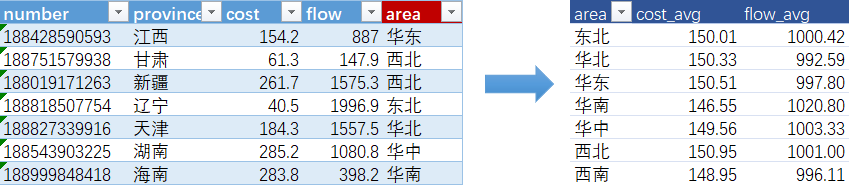
-- 写法一
select
	b.area,
	avg(cost) as cost_avg,
	avg(flow) as flow_avg
from telecom as a
left join area as b
on a.province = b.province
group by area;

-- 写法二
with c as
(
select
	a.*,
	b.area
from telecom as a
left join area as b
on a.province = b.province
)

select
	area,
	round(avg(cost),2) as cost_avg,
	round(avg(flow),2) as flow_avg
from c
group by area;
转化分析
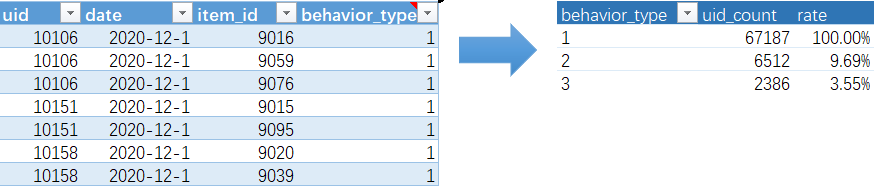
select
	behavior_type,
	count(uid) as uid_count,
	-- (select count(uid) from behavior where behavior_type = 1) as total_type1,
	count(uid) / (select count(uid) from behavior where behavior_type = 1) as rate
from behavior
group by behavior_type;
RFM分析
计算RFM数据指标
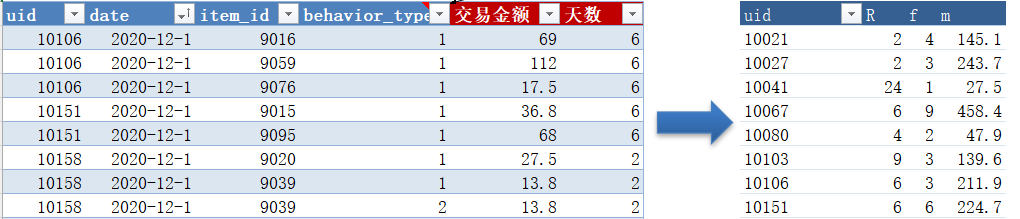
select
	a.uid,
	timestampdiff(day,max(a.date),'2020/12/31') as r,
	count(uid) as f,
	sum(b.price) as m
from behavior as a
left join item as b
on a.item_id = b.item_id
where a.behavior_type = 3
group by a.uid
order by a.uid
计算R分值、F分值、M分值和RFM分值
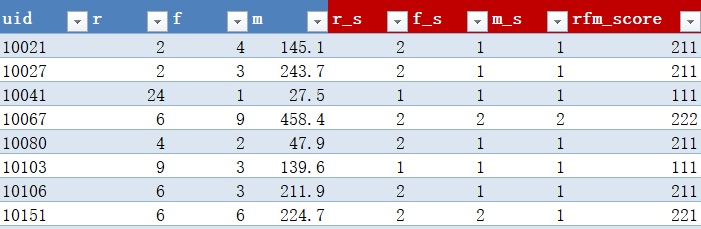
select
	rfm.*,
	if(r < (select avg(r) from rfm),2,1) as r_s,
	if(f > (select avg(f) from rfm),2,1) as f_s,
	if(m > (select avg(m) from rfm),2,1) as m_s,
	if(r < (select avg(r) from rfm),2,1)*100+
	if(f > (select avg(f) from rfm),2,1)*10+
	if(m > (select avg(m) from rfm),2,1) as rfm_score
from rfm
根据RFM分值细分客户
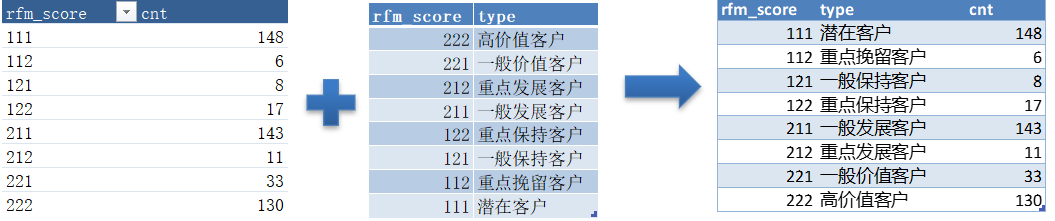
select
	c.rfm_score,
	d.type,
	count(uid) as cnt
from rfm_score as c
left join rfm_type as d
on c.rfm_score = d.rfm_score
group by c.rfm_score
order by c.rfm_score
-- 完整代码
with rfm as
(
select
a.uid,
timestampdiff(day,max(a.date),'2020/12/31') as r,
count(uid) as f,
sum(b.price) as m
from behavior as a
left join item as b
on a.item_id = b.item_id
where a.behavior_type = 3
group by a.uid
order by a.uid
)
,
rfm_score as
(
select
rfm.*,
if(r < (select avg(r) from rfm),2,1) as r_s,
if(f > (select avg(f) from rfm),2,1) as f_s,
if(m > (select avg(m) from rfm),2,1) as m_s,
if(r < (select avg(r) from rfm),2,1)*100+
if(f > (select avg(f) from rfm),2,1)*10+
if(m > (select avg(m) from rfm),2,1) as rfm_score
from rfm
)
select
c.rfm_score,
d.type,
count(uid) as cnt
from rfm_score as c
left join rfm_type as d
on c.rfm_score = d.rfm_score
group by c.rfm_score
order by c.rfm_score;留存分析
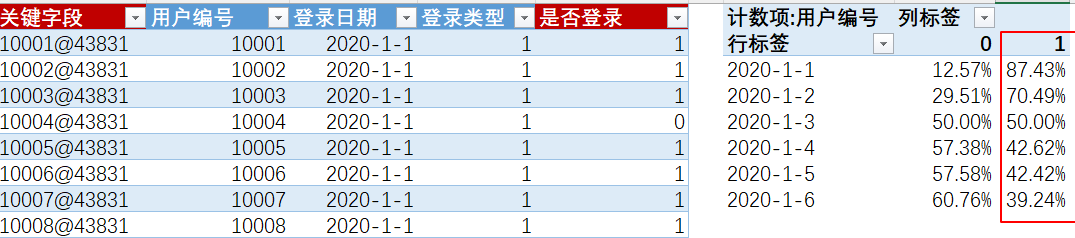
2020/1/1到2020/1/6日新增用户的次日留存率
-- 写法一
with c as
(
select
	a.uid,
	a.date as new_date,
	b.date as date2,
	timestampdiff(day,a.date,b.date) as day
from login as a
left join (select * from login where date between '2020/1/1' and '2020/1/7') as b
on a.uid = b.uid
where a.type = 1 and a.date between '2020/1/1' and '2020/1/6'
order by a.uid,a.date,b.date
)

select
	new_date,
	count(if(day = 0,uid,null)) as day0,
	count(if(day = 1,uid,null)) as day1,
	count(if(day = 1,uid,null))/count(if(day = 0,uid,null)) as 次日留存率
from c
group by new_date;

-- 写法二
select
	a.date,
	sum(case when b.uid is not null then 1 else 0 end)/count(a.uid) as 次日留存率
from (select uid,date,type from login) as a
left join (select uid,date,type from login where date between '2020/1/1' and '2020/1/7') as b
on a.uid = b.uid and b.date = date_add(a.date,interval 1 day)
where a.type = 1 and a.date between '2020/1/1' and '2020/1/6'
group by a.date;
生命周期分析
计算每日新增用户明细
select
	uid,
	date as new_date
from login
where type = 1 and date between '2020/12/1' and '2020/12/6'
计算每日每个客户的消费金额
select
	b.uid,
	b.date as pay_date,
	sum(c.price) as pay
from behavior as b
left join item as c
on b.item_id = c.item_id
where b.behavior_type = 3 and b.date between '2020/12/1' and '2020/12/12'
group by b.uid,b.date
order by b.uid
将新增用户数与用户消费数据连接,计算用户消费日与新增日的间隔天数
select
a.*,
d.pay_date,
d.pay,
timestampdiff(day,a.new_date,d.pay_date) as day
from a
left join d on a.uid = d.uid
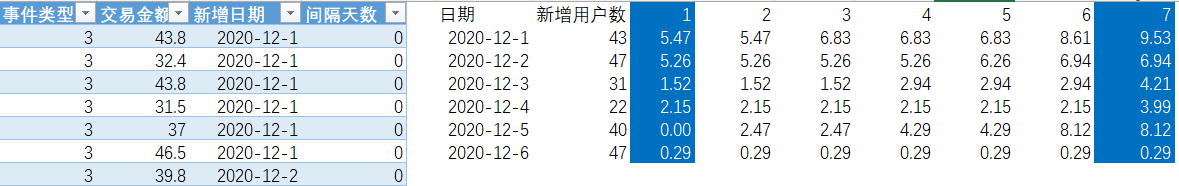
order by a.uid计算新增用户的LTV
select
	new_date,
	count(distinct uid) as 新增用户数,
	sum(if(day = 0,pay,0)) as payday1,
	sum(if(day between 0 and 6,pay,0)) as payday7,
	sum(if(day = 0,pay,0))/count(distinct uid) as LTV1,
	sum(if(day between 0 and 6,pay,0))/count(distinct uid) as LTV7
from e
group by new_date
-- 完整代码
with a as
(
select
uid,
date as new_date
from login
where type = 1 and date between '2020/12/1' and '2020/12/6'
)
,
d as
(
select
b.uid,
b.date as pay_date,
sum(c.price) as pay
from behavior as b
left join item as c
on b.item_id = c.item_id
where b.behavior_type = 3 and b.date between '2020/12/1' and '2020/12/12'
group by b.uid,b.date
order by b.uid
)
,
e as
(
select
a.*,
d.pay_date,
d.pay,
timestampdiff(day,a.new_date,d.pay_date) as day
from a
left join d on a.uid = d.uid
order by a.uid
)
select
new_date,
count(distinct uid) as 新增用户数,
sum(if(day = 0,pay,0)) as payday1,
sum(if(day between 0 and 6,pay,0)) as payday7,
sum(if(day = 0,pay,0))/count(distinct uid) as LTV1,
sum(if(day between 0 and 6,pay,0))/count(distinct uid) as LTV7
from e
group by new_date;

永洪科技,致力于打造全球领先的数据技术厂商,具备从数据应用方案咨询、BI、AIGC智能分析、数字孪生、数据资产、数据治理、数据实施的端到端大数据价值服务能力。
更多推荐

 27
27 0
0- 0


 已为社区贡献8条内容

所有评论(0)