graphviz可视化决策树安装配置
一、windows安装安装graphviz软件:https://graphviz.gitlab.io/_pages/Download/Download_windows.html配置环境变量:把bin文件夹的路径加入到环境变量path里安装python的graphviz模块:pipinstall graphviz二、linux centos7安装yum下载graphviz软件:yum -y inst
·
一、windows安装
- 安装graphviz软件:https://graphviz.gitlab.io/_pages/Download/Download_windows.html
- 配置环境变量:把bin文件夹的路径加入到环境变量path里
- 安装python的graphviz模块:pip install graphviz
二、linux centos7安装
- yum下载graphviz软件:yum -y install graphviz
- 安装python的graphviz模块:pip install graphviz
- 测试:which dot
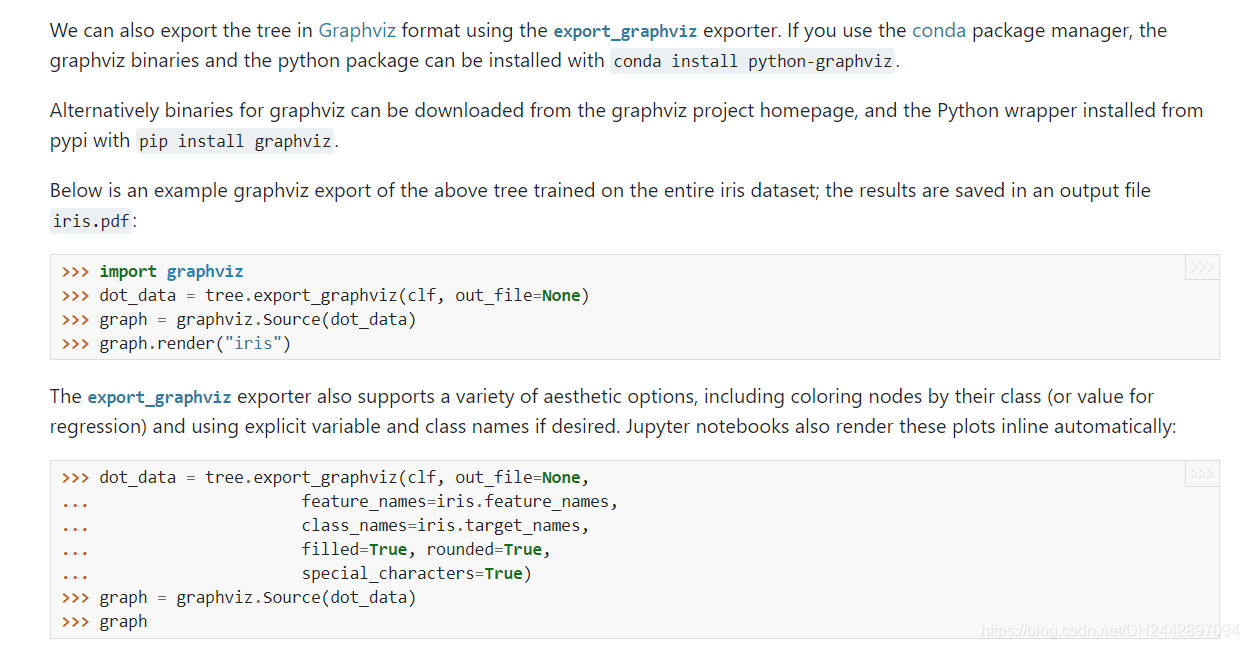
三、使用:
dot_data = export_graphviz(estimator, out_file=None, feature_names=iris.feature_names)
graph = graphviz.Source(dot_data)
graph.render("iris")
四、可能出现的问题:
graphviz.backend.CalledProcessError: Command '['dot', '-Tpdf', '-O', 'iris']' returned non-zero exit status 1. [stderr: b"Error: iris: syntax error in line 1 near 'None'\r\n"]
该错误是:export_graphviz函数参数设置错了,out_file=None 即可运行成功
# 可视化决策树
#dot_data = export_graphviz(estimator, out_file="iris_tree.dot", feature_names=iris.feature_names)
 dot_data = export_graphviz(estimator, out_file=None, feature_names=iris.feature_names)
graph = graphviz.Source(dot_data)

graph.render("iris")
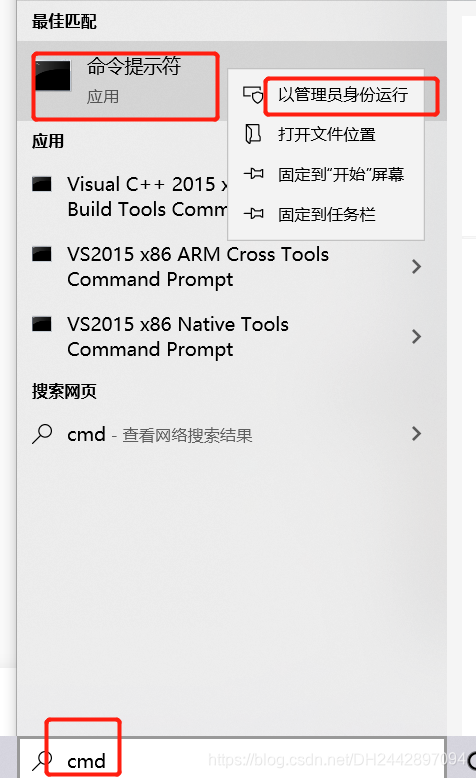
网上很多说是:在管理员权限下的 powershell 中执行 dot -c,试完没啥效果。

永洪科技,致力于打造全球领先的数据技术厂商,具备从数据应用方案咨询、BI、AIGC智能分析、数字孪生、数据资产、数据治理、数据实施的端到端大数据价值服务能力。
更多推荐

 0
0 0
0- 0


 已为社区贡献1条内容

所有评论(0)