前端数据可视化之使用 canvas、svg、zrender画图
随着大数据时代的到来,数据可视化的开发需求越来越多,虽然在开发中一直都有在写可视化图表,但都停留在调框架会用的阶段,最近抽时间去深入学习数据可视化,简单记录下现在市场上的 前端数据可视化解决方案其实很多,如下:本文主要记录下 canvas、svg、zrender的相关知识1、canvascanvas是html5的新特性,他允许我们使用canvas元素在网页上通过脚本,通常是Javascript绘制
随着大数据时代的到来,数据可视化的开发需求越来越多,虽然在开发中一直都有在写可视化图表,但都停留在调框架会用的阶段,最近抽时间去深入学习数据可视化,简单记录下
现在市场上的 前端数据可视化解决方案其实很多,如下:
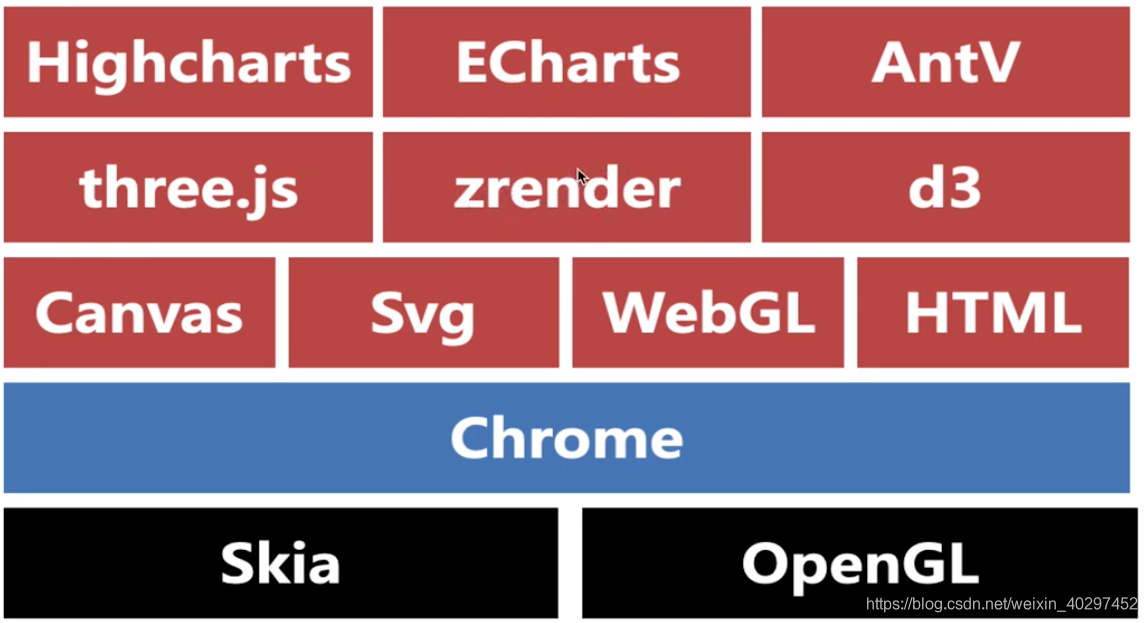
本文主要记录下 canvas、svg、zrender的相关知识
1、canvas
canvas是html5的新特性,他允许我们使用canvas元素在网页上通过脚本,通常是Javascript绘制图像,<canvas> 元素本身并没有绘制能力(它仅仅是图形的容器),我们必须使用脚本来完成实际的绘图任务。getContext() 方法可返回一个对象,该对象提供了用于在画布上绘图的方法和属性。
官方详细文档传送门:https://www.w3school.com.cn/tags/html_ref_canvas.asp
小demo
<!DOCTYPE html>
<html><head><title>canvas</title></head>
<body>
    <canvas id="canvas" width="800" height="800"></canvas>
    <script>
        const canvas = document.getElementById('canvas');
        const ctx = canvas.getContext('2d');
        //画矩形
        ctx.fillStyle = 'red';//填充颜色
        ctx.fillRect(0, 0, 50, 100);//绘制矩形
        //画线
        ctx.beginPath();
        ctx.lineWidth = 2;
        ctx.strokeStyle = 'blue';
        ctx.moveTo(100, 100);//起点坐标
        ctx.lineTo(150, 50);
        ctx.lineTo(200, 100);
        ctx.stroke();//绘制线段
        //画圆
        ctx.beginPath();
        ctx.lineWidth = 1;
        ctx.strokeStyle = 'green';
        ctx.fillStyle = 'red'
        ctx.arc(300, 60, 50, 0, 2 * Math.PI);//绘制圆
        ctx.stroke();
        ctx.fill();
    </script>
</body></html>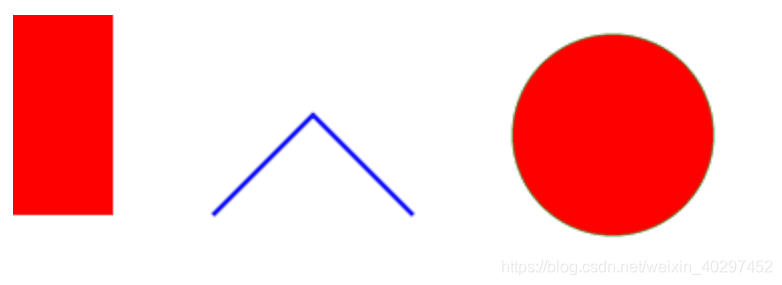
2、SVG(Scalable Vector Graphics)
svg是可缩放矢量图形的意思,他是一种基于XML的图像文件格式,所以图像在放大或改变尺寸的情况下其图形质量不会有所损失,这是他的一大优点,常用于做logo和图标。
官方详细文档传送门:https://www.w3school.com.cn/svg/index.asp
<!DOCTYPE html>
<html><head><title>SVG</title></head>
<body>
    <svg width="800" height="800">
        <rect width='100' height='100' style="fill:red" />
        <line x1='150' y1='100' x2='250' y2='50' style="stroke: blue; stroke-width:1;" />
        <line x1='250' y1='50' x2='350' y2='100' style="stroke: blue; stroke-width:1;" />
        <circle cx='450' cy='60' r='50' stroke='green' stroke-width='2' fill='red'></circle>
        <!-- 画点 -->
        <line x1='570' y1='75' x2='571' y2='76' style="stroke: red; stroke-width:1;" />
    </svg>
</body>
</html>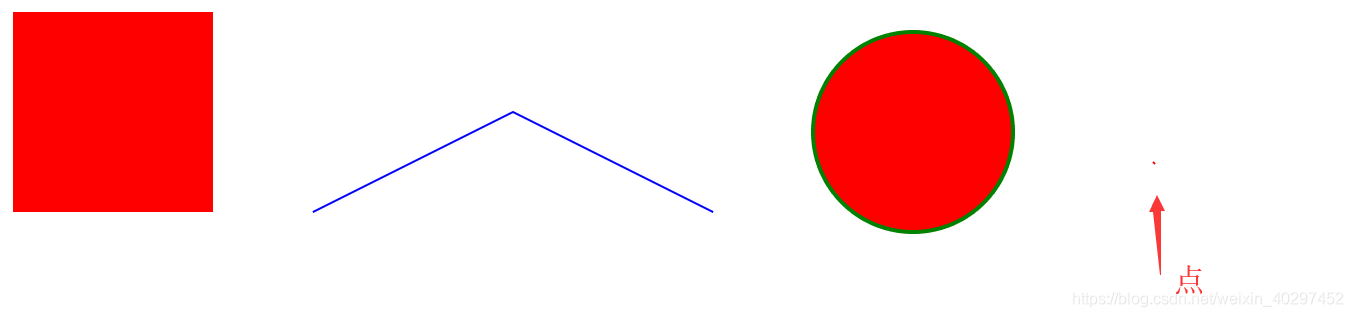
3、zrender
zrender是二维绘图引擎,它提供 Canvas、SVG、VML 等多种渲染方式。ZRender 也是 ECharts 的渲染器。
官方详细文档传送门:https://ecomfe.github.io/zrender-doc/public/api.html
<!DOCTYPE html>
<html><head>
    <title>zrender</title>
    <script src="https://cdn.bootcss.com/zrender/4.0.7/zrender.min.js"></script>
</head>
<body>
    <div id="container" style="width: 800px; height: 800px;"></div>
    <script>
        const zr = zrender.init(document.getElementById('container'));
        const rect = new zrender.Rect({
            shape: {
                x: 0,
                y: 0,
                width: 100,
                height: 100
            },
            style: {
                fill: 'red',
                lineWidth: 0
            }
        })
        const line = new zrender.Polyline({
            shape: {
                points: [
                    [150, 100],
                    [250, 50],
                    [350, 100]
                ]
            },
            style: {
                stroke: 'blue',
                lineWidth: 2
            }
        })
        const circle = new zrender.Circle({
            shape: {
                cx: 450,
                cy: 60,
                r: 50,
            },
            style: {
                fill: 'red',
                stroke: 'blue',
                lineWidth: 2
            }
        })
        const point = new zrender.Polyline({
            shape: {
                points: [
                    [570, 50],
                    [571, 51],
                ]
            },
            style: {
                stroke: 'red',
                lineWidth: 2
            }
        })
        zr.add(rect);
        zr.add(line);
        zr.add(circle);
        zr.add(point);
    </script>
</body>
</html>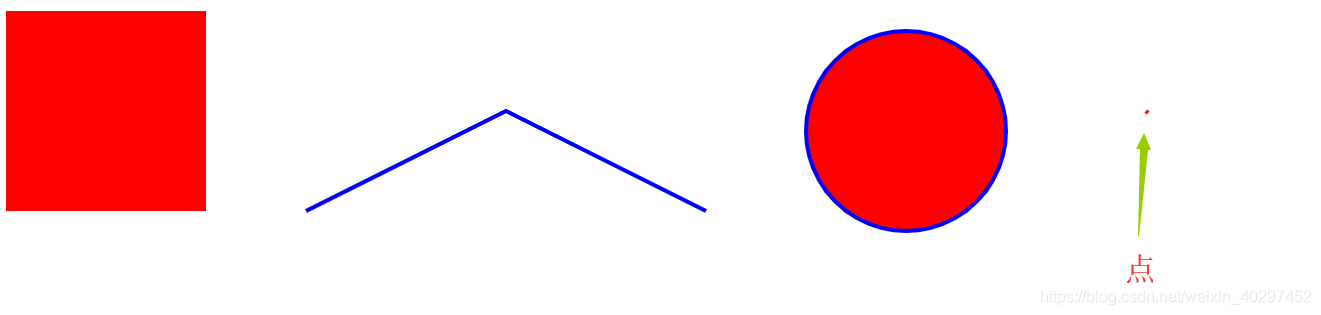
ps:学习过程的简单记录,如有不恰当之处,欢迎指正!

永洪科技,致力于打造全球领先的数据技术厂商,具备从数据应用方案咨询、BI、AIGC智能分析、数字孪生、数据资产、数据治理、数据实施的端到端大数据价值服务能力。
更多推荐


 3
3 0
0- 0


 已为社区贡献1条内容

所有评论(0)