Python金融数据挖掘 第6章 第1节 (3)泰坦尼克号分析
1、基本处理import matplotlib as mplimport matplotlib.pyplot as pltimport seaborn as snsimport pandas as pdimport numpy as np# %matplotlib inline# 处理seaborn图标内嵌中文字体问题plt.rcParams['font.sans-serif']=['SimHei
1、基本处理
import matplotlib as mpl
import matplotlib.pyplot as plt
import seaborn as sns
import pandas as pd
import numpy as np

# %matplotlib inline

# 处理seaborn图标内嵌中文字体问题
plt.rcParams['font.sans-serif']=['SimHei']
plt.rcParams['axes.unicode_minus']=False
sns.set_style('whitegrid',{'font.sans-serif':['simhei','Arial']})
2、问题1
原始数据不能下载,所以不能直接访问下载数据,需要手动下载后离线加载数据
解决:
# 载入泰坦尼克数据库,显示乘客信息的头5行
PasTit=pd.read_csv('titanic.csv')
print('前5行数据:')
print(PasTit.head())
[out]:
前5行数据:
survived pclass sex age ... deck embark_town alive alone
0 0 3 male 22.0 ... NaN Southampton no False
1 1 1 female 38.0 ... C Cherbourg yes False
2 1 3 female 26.0 ... NaN Southampton yes True
3 1 1 female 35.0 ... C Southampton yes False
4 0 3 male 35.0 ... NaN Southampton no True[5 rows x 15 columns]
3、统计幸存者的性别比例
# .groupby 重新整理
survived=PasTit.groupby(['sex','survived']).size().unstack() #2*2

survived['sum']=survived[0]+survived[1]
survived['生还率']=survived[1]/survived['sum']
print()
print('乘客按照性别统计的生还者和遇难者:')
print('0:遇难;1:生还')
print(survived)
[out]:
乘客按照性别统计的生还者和遇难者:
0:遇难;1:生还
survived 0 1 sum 生还率
sex
female 81 233 314 0.742038
male 468 109 577 0.188908
4、票价、幸存
# #####票价、幸存
# 两个取交集
fare_surv=PasTit.loc[PasTit['survived']==1,'fare']
fare_unsurv=PasTit.loc[PasTit['survived']==0,'fare']

print()
print('生还者船票价格统计描述:')
print(fare_surv.describe())
print('遇难者船票价格统计描述:')
print(fare_unsurv.describe())
[out]:
生还者船票价格统计描述:
count 342.000000
mean 48.395408
std 66.596998
min 0.000000
25% 12.475000
50% 26.000000
75% 57.000000
max 512.329200
Name: fare, dtype: float64
遇难者船票价格统计描述:
count 549.000000
mean 22.117887
std 31.388207
min 0.000000
25% 7.854200
50% 10.500000
75% 26.000000
max 263.000000
Name: fare, dtype: float64
5、画图、问题2
问题2 原始code由于版本的变化将hist图与kde图单独设置了函数,因此需要进行修改。
# 画图
f,ax=plt.subplots(figsize=(7,7))

#sns.displot(d1,hist=False,label='Survived',kde_kws={'color':'r','lw':1}).set(ylim=(0,0.058),xlim=(0,300))
sns.kdeplot(np.array(fare_surv),label='Survived',color='r',lw=1,marker='*').set(ylim=(0,0.058),xlim=(0,300))

#sns.displot(e1,hist=False,label='UnSurvived',kde_kws={'color':'k','lw':3,'marker':'o'})
sns.kdeplot(np.array(fare_unsurv),label='UnSurvived',color='k',lw=3,marker='o')

plt.legend()  #问题3 课本上忽略了,所以不能显示图例
ax.set(title='幸存/遇难者票价分布')
plt.savefig('ch05_seaGet',dpi=300,bbox_inches='tight')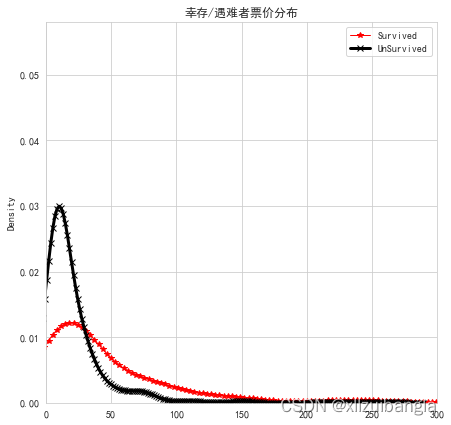
6、区分
# 区分
survived=PasTit.groupby(['sex','survived']).size().unstack() #2*2
s1=PasTit.groupby(['sex','survived']).size()
s4=PasTit.groupby(['sex','survived'])
s2=PasTit.groupby('sex').size()
s3=PasTit.groupby('survived').size()
[out]:
s1
sex survived
female 0 81
1 233
male 0 468
1 109
dtype: int64
s4
<pandas.core.groupby.generic.DataFrameGroupBy object at 0x000001E94104B280>s2
sex
female 314
male 577
dtype: int64
s3
survived
0 549
1 342
dtype: int64

永洪科技,致力于打造全球领先的数据技术厂商,具备从数据应用方案咨询、BI、AIGC智能分析、数字孪生、数据资产、数据治理、数据实施的端到端大数据价值服务能力。
更多推荐


 1
1 0
0- 0


 已为社区贡献6条内容

所有评论(0)