
ELK之可视化展示和轻量采集
Kibana是一个数据分析和可视化工具,可将Elasticsearch中的数据转化为交互式的图表和仪表盘,帮助用户更好地理解和利用数据。
目录
什么是kibana
Kibana是一个数据分析和可视化工具,可将Elasticsearch中的数据转化为交互式的图表和仪表盘,帮助用户更好地理解和利用数据。
部署
安装包
[root@vm10 ~]# rpm -ivh kibana-7.6.1-x86_64.rpm
编辑文件
[root@vm10 kibana]# vim kibana.yml
server.host: "192.168.56.180" #监听端口
elasticsearch.hosts: ["http://192.168.56.177:9200"] #连接集群
i18n.locale: "zh-CN" #中文
启动,并查看端口,成功
[root@vm10 kibana]# systemctl enable --now kibana
[root@vm10 kibana]# netstat -antlp |grep :5601
tcp 0 0 192.168.56.180:5601 0.0.0.0:* LISTEN 25385/node
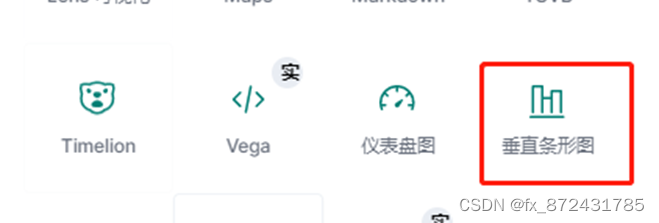
定制数据可视化
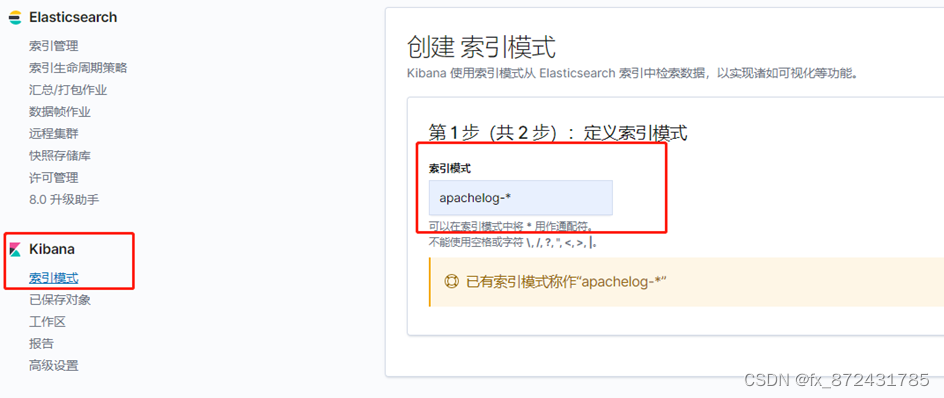
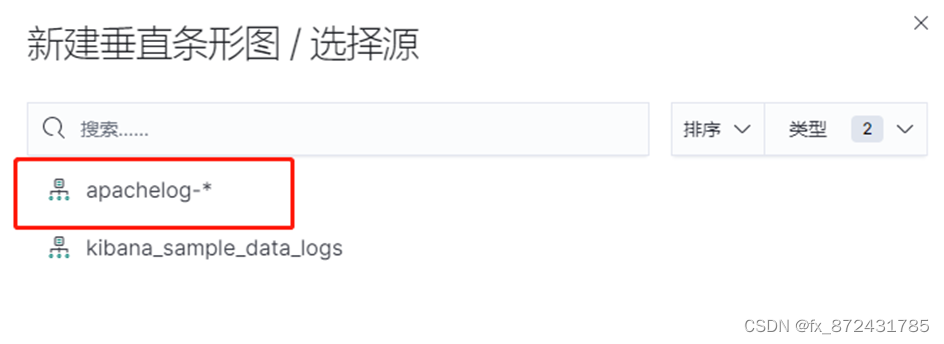
创建索引模式
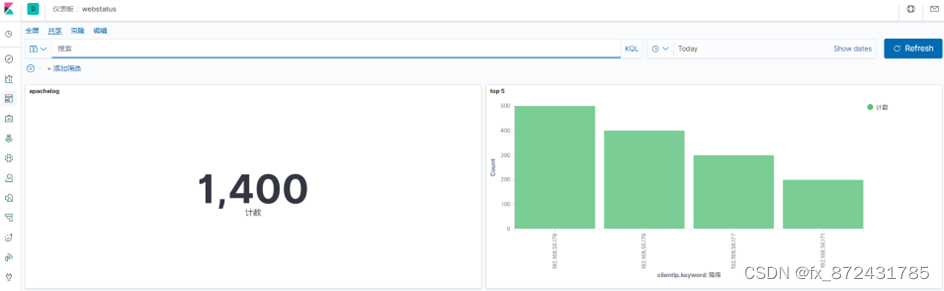
网站访问量
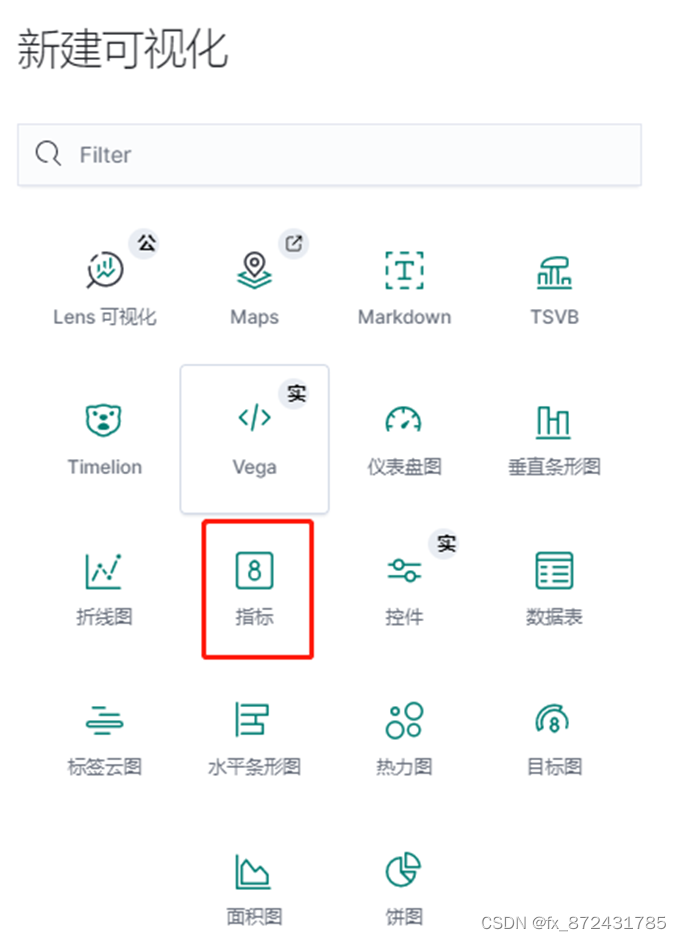

访问量排行榜
分别使用ab命令对其压测
创建dashboard,大屏展示
ES集群启用xpack认证
目前部署的ELK三个软件端口都是开放的,任何人都能访问,没有任何安全保障,容易受到攻击,所以使用 xpack安全组件来保护ELK
xpack安全组件是ELK中的一个安全插件,提供了访问控制、用户认证、角色基础访问控制、客户端-服务器传输安全等功能,帮助保护ELK集群中的数据安全。它可帮助用户实现对敏感数据的可视化和分析,同时保障集群运行安全
在vm7上生成证书
[root@vm7 ~]# cd /usr/share/elasticsearch/
[root@vm7 elasticsearch]# bin/elasticsearch-certutil ca
[root@vm7 elasticsearch]# bin/elasticsearch-certutil cert --ca elastic-stack-ca.p12
把证书复制到elasticsearch的配置目录,文件拥有者改为 elasticsearch,以便elasticsearch可以使用证书,或者直接改权限大小也行。
[root@vm7 elasticsearch]# cp elastic-certificates.p12 /etc/elasticsearch
[root@vm7 elasticsearch]# cd /etc/elasticsearch/
[root@vm7 elasticsearch]# chown elasticsearch elastic-certificates.p12
修改elasticsearch的主配置文件,开启xpack安全验证
[root@vm7 elasticsearch]# vim elasticsearch.yml
...
http.cors.allow-headers: Authorization,X-Requested-With,Content-Length,Content-Type
xpack.security.enabled: true
xpack.security.transport.ssl.enabled: true
xpack.security.transport.ssl.verification_mode: certificate
xpack.security.transport.ssl.keystore.path: /etc/elasticsearch/elastic-certificates.p12
xpack.security.transport.ssl.truststore.path: /etc/elasticsearch/elastic-certificates.p12
[root@vm7 elasticsearch]# systemctl restart elasticsearch.service
拷贝证书到其他节点
[root@vm7 elasticsearch]# scp elastic-certificates.p12 vm8:/etc/elasticsearch/
[root@vm7 elasticsearch]# scp elastic-certificates.p12 vm9:/etc/elasticsearch/
vm8配置
[root@vm8 ~]# chown elasticsearch /etc/elasticsearch/elastic-certificates.p12
[root@vm8 ~]# vim /etc/elasticsearch/elasticsearch.yml
xpack.security.enabled: true
xpack.security.transport.ssl.enabled: true
xpack.security.transport.ssl.verification_mode: certificate
xpack.security.transport.ssl.keystore.path: /etc/elasticsearch/elastic-certificates.p12
xpack.security.transport.ssl.truststore.path: /etc/elasticsearch/elastic-certificates.p12
[root@vm8 ~]# systemctl restart elasticsearch.service
vm9配置
[root@vm9 ~]# chown elasticsearch /etc/elasticsearch/elastic-certificates.p12
[root@vm9 ~]# vim /etc/elasticsearch/elasticsearch.yml
xpack.security.enabled: true
xpack.security.transport.ssl.enabled: true
xpack.security.transport.ssl.verification_mode: certificate
xpack.security.transport.ssl.keystore.path: /etc/elasticsearch/elastic-certificates.p12
xpack.security.transport.ssl.truststore.path: /etc/elasticsearch/elastic-certificates.p12
[root@vm9 ~]# systemctl restart elasticsearch.service
设置认证账户密码
[root@vm7 elasticsearch]# cd /usr/share/elasticsearch/
[root@vm7 elasticsearch]# bin/elasticsearch-setup-passwords interactive
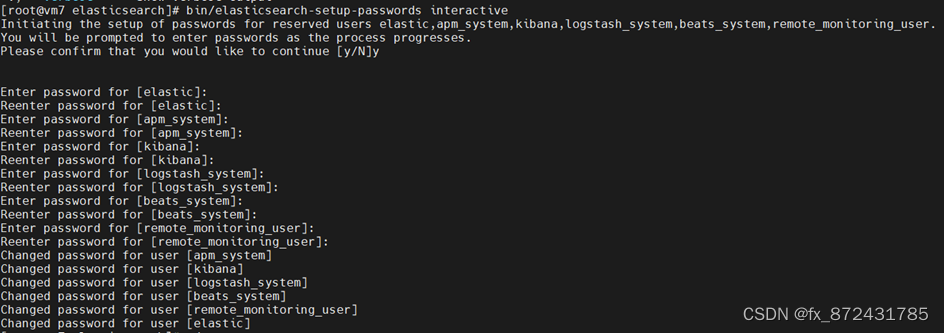
ES启用xpack之后,其它服务都需要配置认证
head插件访问:
http://192.168.56.171:9100/?auth_user=elastic&auth_password=westos
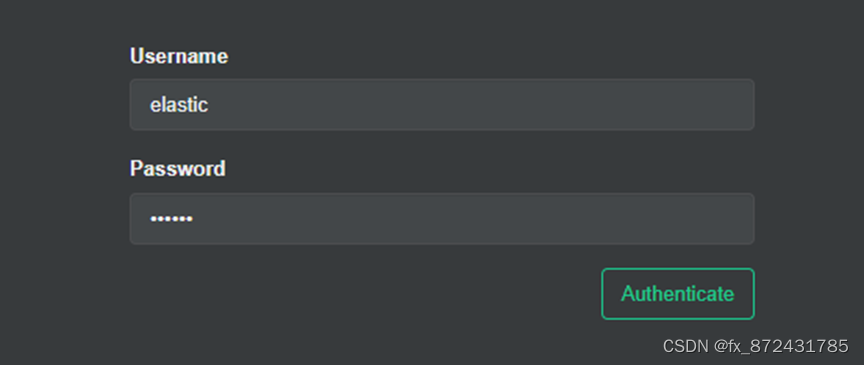
cerebro访问:
logstash配置,添加用户名和密码
[root@vm10 ~]# vim /etc/logstash/conf.d/grok.conf
input {
file {
path => "/var/log/httpd/access_log"
start_position => "beginning"
}
}
filter {
grok {
match => { "message" => "%{HTTPD_COMBINEDLOG}" }
}
}
output {
stdout {}
elasticsearch {
hosts => "192.168.56.177:9200"
index => "apachelog-%{+YYYY.MM.dd}"
user => "elastic"
password => "westos"
}
}
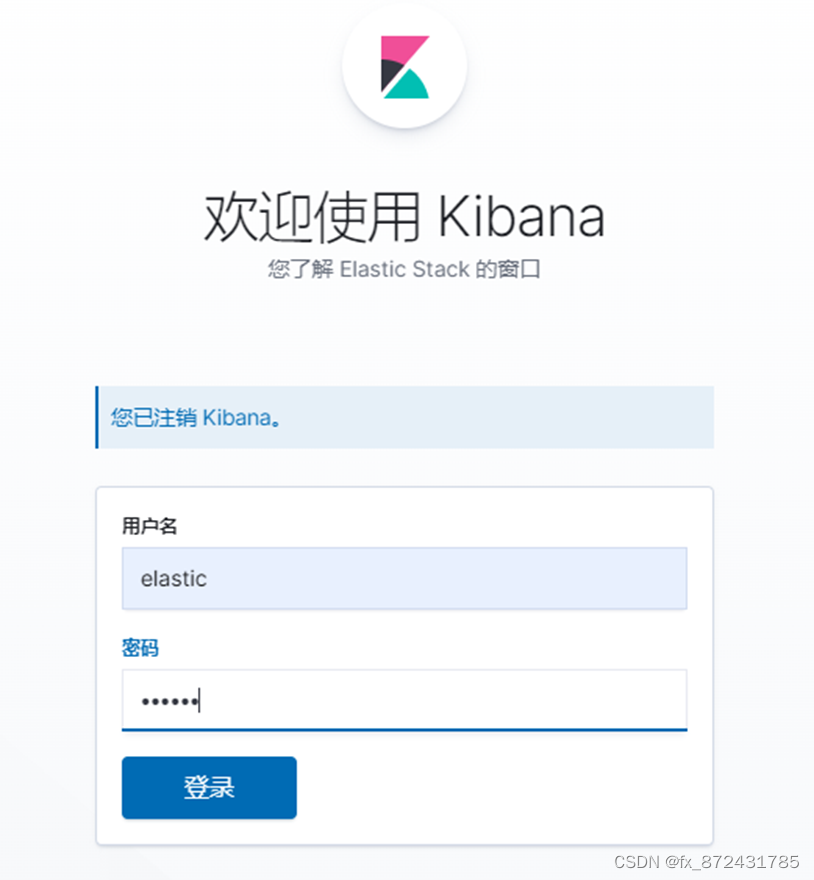
kibana配置,添加访问es集群的用户和密码
[root@vm10 kibana]# vim kibana.yml
...
elasticsearch.username: "kibana"
elasticsearch.password: "westos"
[root@vm10 kibana]# systemctl restart kibana.service
[root@vm10 kibana]# netstat -antlp|grep :5601
tcp 1 0 0.0.0.0:5601 0.0.0.0:* LISTEN 35945/node
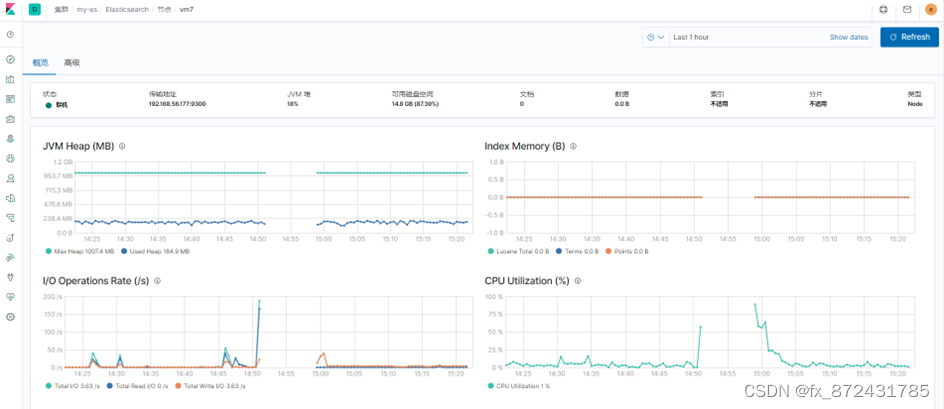
metricbeat监控
Metricbeat是一款轻量级的数据采集工具,可在系统或服务级别上监控各种度量信息,如CPU、内存和磁盘空间利用率、网络流量以及数据库或消息队列等服务性能指标,并将这些数据发送到Elasticsearch或Logstash中进行分析。Metricbeat可以通过开箱即用的方式监测Web、容器、云服务、操作系统和服务等,在不同环境下都可以快速轻松地部署使用,并提供可视化、报警等多种功能,帮助用户进行实时监控和健康评估。
进入kibana,集群 -> 使用metricbeat
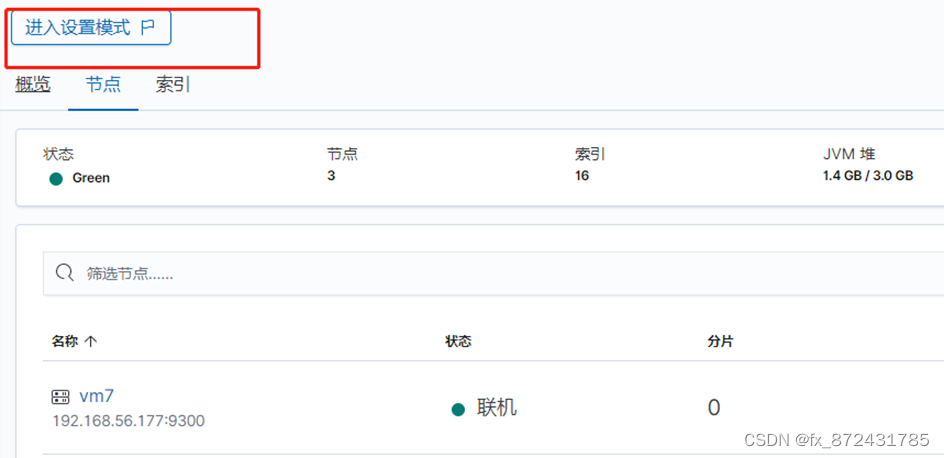
点击使用metricbeat,现在是红色的,还不可用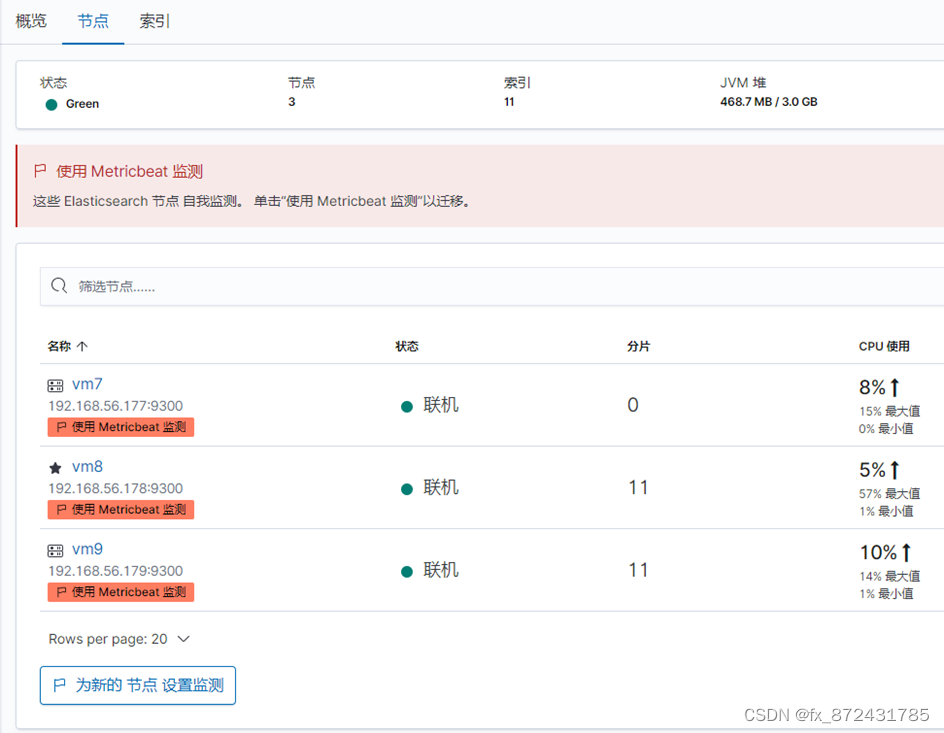
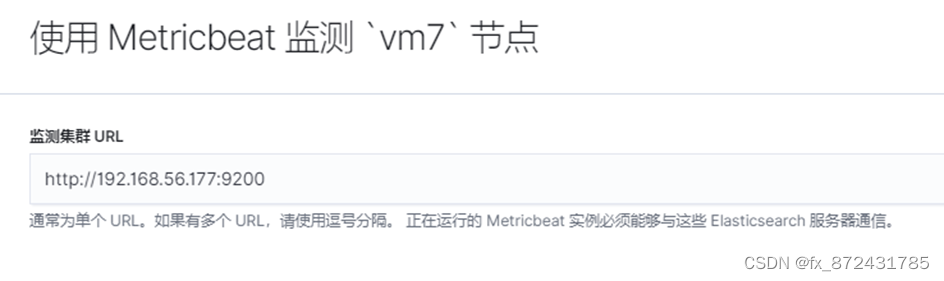
输入监测集群URLhttp://192.168.56.177:9200,会出现提示操作
 下载metricbeat安装包,激活elasticsearch-xpack
[root@vm7 ~]# rpm -ivh metricbeat-7.6.1-x86_64.rpm
[root@vm7 ~]# cd /etc/metricbeat/modules.d
[root@vm7 modules.d]# metricbeat modules enable elasticsearch-xpack
编辑文件,由于开启了xpack,需要添加用户名和密码
[root@vm7 modules.d]# vim elasticsearch-xpack.yml
- module: elasticsearch
metricsets:
- ccr
- cluster_stats
- enrich
- index
- index_recovery
- index_summary
- ml_job
- node_stats
- shard
period: 10s
hosts: ["http://localhost:9200"]
username: "elastic"
password: "westos"
xpack.enabled: true
返回上一层,修改metricbeat主配置文件
设置es的ip(集群中任意一个都可以),添加用户名和密码
[root@vm7 modules.d]# cd ..
[root@vm7 metricbeat]# vim metricbeat.yml
...
output.elasticsearch:
hosts: ["localhost:9200"]
username: "elastic"
password: "westos"
[root@vm7 metricbeat]# systemctl enable --now metricbeat.service
稍等片刻,es集群的三个节点都是蓝色了,成功开启
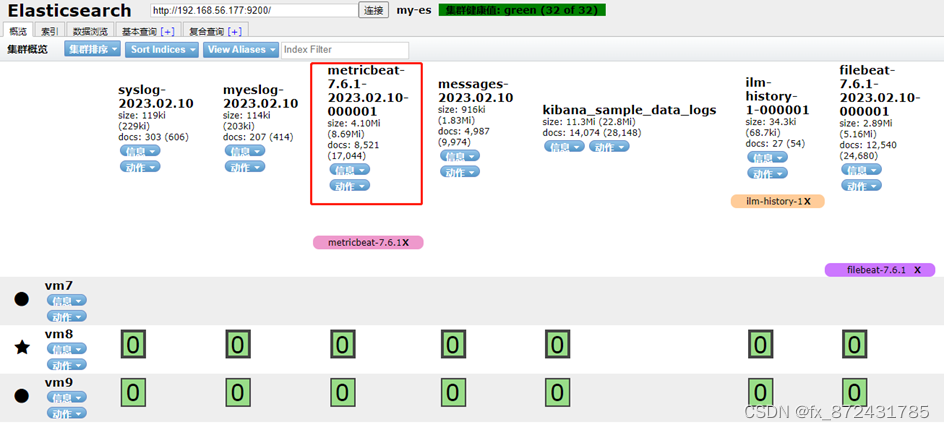
其它节点以此类推
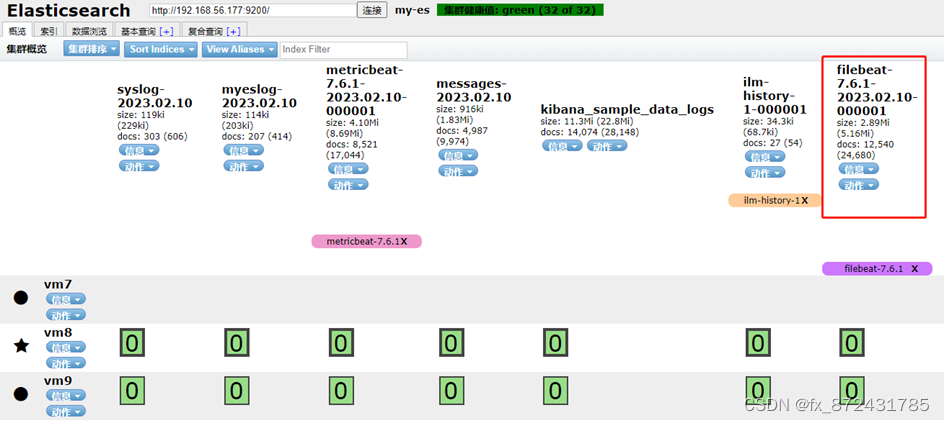
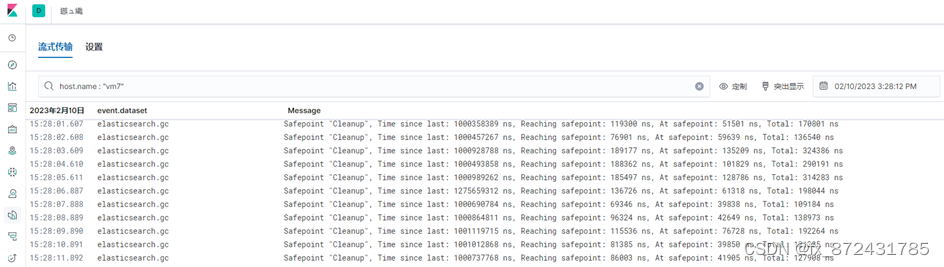
filebeat日志采集
类似的轻量级采集的base还有很多,比如filebeat
文档:Elasticsearch module | Filebeat Reference [7.6] | Elastic
同上,安装并启动elasticsearch模块
[root@vm7 ~]# rpm -ivh filebeat-7.6.1-x86_64.rpm
[root@vm7 ~]# cd /etc/filebeat/modules.d
[root@vm7 modules.d]# filebeat modules enable elasticsearch
编辑文件
[root@vm7 modules.d]# vim elasticsearch.yml
- module: elasticsearch
# Server log
server:
enabled: true
# Set custom paths for the log files. If left empty,
# Filebeat will choose the paths depending on your OS.
var.paths:
- /var/log/elasticsearch/*.log # Plain text logs
- /var/log/elasticsearch/*_server.json # JSON logs
gc:
enabled: true
# Set custom paths for the log files. If left empty,
# Filebeat will choose the paths depending on your OS.
var.paths:
- /var/log/elasticsearch/gc.log.[0-9]*
- /var/log/elasticsearch/gc.log
audit:
enabled: true
# Set custom paths for the log files. If left empty,
# Filebeat will choose the paths depending on your OS.
var.paths:
- /var/log/elasticsearch/*_access.log # Plain text logs
- /var/log/elasticsearch/*_audit.json # JSON logs
slowlog:
enabled: true
# Set custom paths for the log files. If left empty,
# Filebeat will choose the paths depending on your OS.
var.paths:
- /var/log/elasticsearch/*_index_search_slowlog.log # Plain text logs
- /var/log/elasticsearch/*_index_indexing_slowlog.log # Plain text logs
- /var/log/elasticsearch/*_index_search_slowlog.json # JSON logs
- /var/log/elasticsearch/*_index_indexing_slowlog.json # JSON logs
deprecation:
enabled: true
# Set custom paths for the log files. If left empty,
# Filebeat will choose the paths depending on your OS.
var.paths:
- /var/log/elasticsearch/*_deprecation.log # Plain text logs
- /var/log/elasticsearch/*_deprecation.json # JSON logs
返回上一层,修改filebeat主配置文件
设置es的ip,添加用户名和密码
[root@vm7 modules.d]# cd ..
[root@vm7 filebeat]# vim filebeat.yml
...
output.elasticsearch:
hosts: ["localhost:9200"]
username: "elastic"
password: "westos"
[root@vm7 filebeat]# systemctl enable --now filebeat.service

永洪科技,致力于打造全球领先的数据技术厂商,具备从数据应用方案咨询、BI、AIGC智能分析、数字孪生、数据资产、数据治理、数据实施的端到端大数据价值服务能力。
更多推荐

 1
1 0
0- 0


 已为社区贡献1条内容

所有评论(0)