Python 交互式数据可视化plotly
Python 交互式数据可视化plotly
·
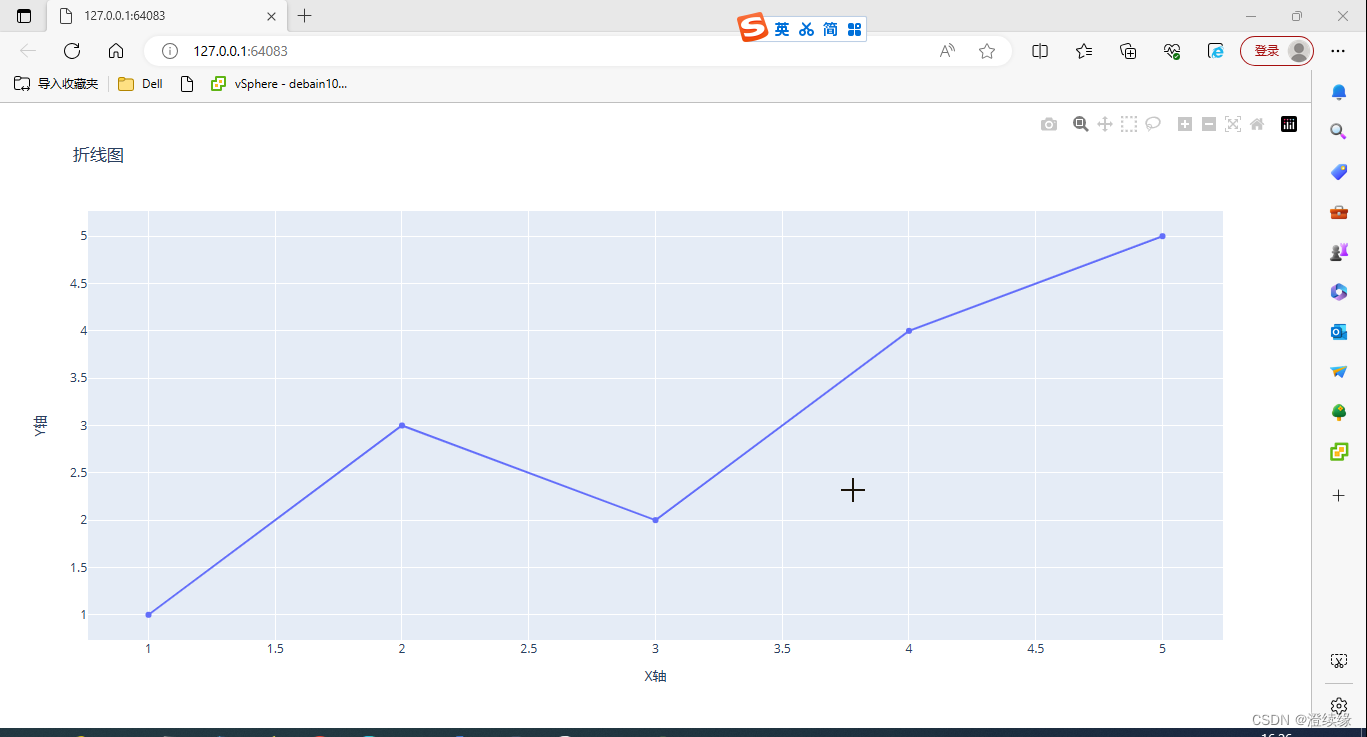
import plotly.graph_objects as go

# 创建数据
x = [1, 2, 3, 4, 5]
y = [1, 3, 2, 4, 5]

# 创建图表
fig = go.Figure(data=go.Scatter(x=x, y=y))

# 设置图表布局
fig.update_layout(title='折线图', xaxis_title='X轴', yaxis_title='Y轴')

# 显示图表
fig.show()

永洪科技,致力于打造全球领先的数据技术厂商,具备从数据应用方案咨询、BI、AIGC智能分析、数字孪生、数据资产、数据治理、数据实施的端到端大数据价值服务能力。
更多推荐

 0
0 0
0- 0


 已为社区贡献2条内容

所有评论(0)