Python数据可视化Part 5-Matplotlib 3D图片与投影教学-代码详解
下面代码在实际操作中稍作修改即可使用代码步骤:3D图需要额外导入模块将默认figure图转化为3D图给出x,y的坐标数据画出网格线给出高度Z的值画出图像将颜色进行投影限制画图的坐标轴范围代码如下:import numpy as npimport matplotlib.pyplot as plt# 3D图需要额外导入模块from mpl_toolkits.mplot3d import Axes3D#
·
下面代码在实际操作中稍作修改即可使用
代码步骤:
- 3D图需要额外导入模块
- 将默认figure图转化为3D图
- 给出x,y的坐标数据
- 画出网格线
- 给出高度Z的值
- 画出图像
- 将颜色进行投影
- 限制画图的坐标轴范围
代码如下:
import numpy as np
import matplotlib.pyplot as plt
# 3D图需要额外导入模块
from mpl_toolkits.mplot3d import Axes3D
# 将默认figure图转化为3D图
fig = plt.figure()
ax = Axes3D(fig)
# 给出x,y的坐标数据
X = np.arange(-4,4,0.25)
Y = np.arange(-4,4,0.25)
# 画出网格线
X,Y = np.meshgrid(X,Y)
# 给出高度Z的值
R=np.sqrt(X ** 2 + Y ** 2)
Z = np.sin(R)
# 画出图像 rstride:横向的分割线跨度(越小越密集) cstride:纵向的分割线跨度(越小越密集)
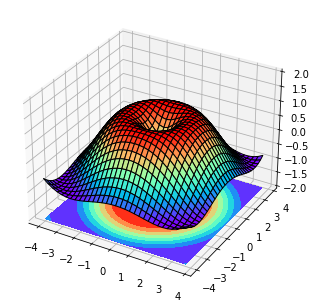
ax.plot_surface(X,Y,Z,rstride=1,cstride=1,cmap=plt.get_cmap('rainbow'),edgecolor='black')
# 将颜色进行投影
# zdir后的参数决定从哪个方位进行投影 offset的参数表示投影到该方位坐标的哪个点对应的坐标平面
ax.contourf(X,Y,Z,zdir='z',offset=-2,cmap='rainbow')
# 限制画图的坐标轴范围
ax.set_zlim(-2,2)
plt.show()效果:

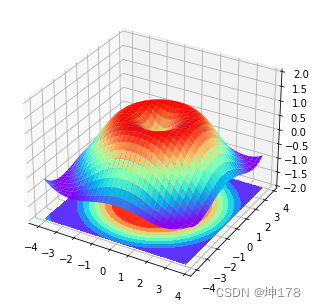
# edgecolor='None'时
ax.plot_surface(X,Y,Z,rstride=1,cstride=1,cmap=plt.get_cmap('rainbow'),edgecolor='None')

永洪科技,致力于打造全球领先的数据技术厂商,具备从数据应用方案咨询、BI、AIGC智能分析、数字孪生、数据资产、数据治理、数据实施的端到端大数据价值服务能力。
更多推荐


 5
5 0
0- 0


 已为社区贡献2条内容

所有评论(0)