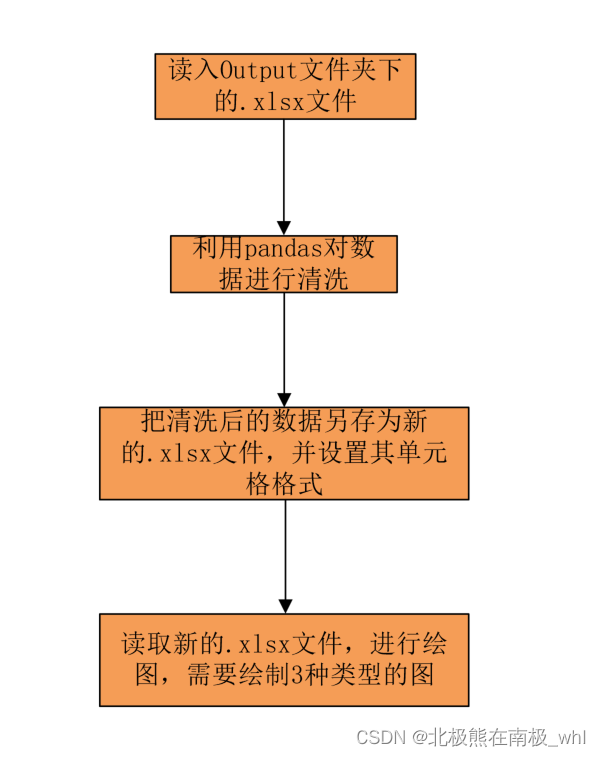
利用Python中的pandas+numpy+openpyxl+matplotlib.pyplot+matplotlib.patches+正则表达式等模块对xlsx文件进行数据清洗并进行数据可视化分析
在日常工作中,我们经常需要对excel文件中的数据进行清洗,剔除掉我们不需要的数据,抓取我们想要的数据,并把想要的数据保存在新的excel中,再对新的清洗后的excel进行一些数据可视化分析等操作。那在本博文接下来所讲的内容里,我使用pandas、openpyxl、re等模块对数据进行清洗;然后利用pandas、openpyxl把清洗后的数据存在新的excel中;
前言
在日常工作中,我们经常需要对excel文件中的数据进行清洗,剔除掉我们不需要的数据,抓取我们想要的数据,并把想要的数据保存在新的excel中,再对新的清洗后的excel进行一些数据可视化分析等操作。那在本博文接下来所讲的内容里,我使用pandas、openpyxl、re等模块对数据进行清洗;然后利用pandas、openpyxl把清洗后的数据存在新的excel中;最后利用matplotlib.pyplot、matplotlib.patches、re、datetime、os、glob等模块对清洗好的数据表格进行数据可视化分析。本文中所讲的代码绘制的是一些工程用图,这里不便展示。本文重点介绍代码的逻辑结构和思想,以及对一些细节的处理。
一、项目背景:
在我们的日常工作中,经常会遇到数据很杂乱的表格,而我们想要的数据就分布在这些杂乱的表格中。此时,我们就需要把我们想要的数据从这些杂乱的表格中提取出来,单独存放在我们想要的位置。那么,本博文就从这个角度来深度解析如何实现这一功能!
二、输入的.xlsx文件的sheet名样板和脚本主体逻辑架构图:
1.输入的.xlsx文件的sheet名样板

2.脚本主体逻辑架构图

三、脚本功能模块解析
1.引入库
代码如下:
import numpy as np
import pandas as pd
import matplotlib.patches as patches
import matplotlib.pyplot as plt
import datetime as dt
import openpyxl
from openpyxl.utils import get_column_letter
import re
import os
import glob
import warnings
warnings.filterwarnings('ignore')
2.设置pandas在console的输出模式为显示所有的列
代码如下:
pd.options.display.max_columns = None
3.获取Output文件夹下的.xlsx文件的相对路径
代码如下:
# 获取当前脚本文件所在目录
path_current = os.getcwd()
# 获取当前脚本文件所在目录的上一级目录
path_pardir = os.path.dirname(path_current)
print('$$$path_pardir:', path_pardir)
file_lists = glob.glob(path_pardir + '/Output/*.xlsx')
print('$$$file_lists:', file_lists)
4.初始化定义
代码如下:
# 先定义好需要提取的有效信息的列名
column_common = ['lot_id', 'wf_id', 'die_x', 'die_y', 'SBIN_NUM']
# column_private = ['Istandby:VDD[1]', 'Istandby:VDDI[1]', 'Istandby:VDD_SRAM[1]', 'Istandby:VDDIO[1]',
# 'Scan_HV', 'Scan_MV', 'Scan_LV', 'M6N_HV', 'M6N_MV', 'M6N_LV', 'Data_Retention_0', 'Data_Retention_1']

abnormal_character_set = ['/', '\\', ':', '*', '"', '<', '>', '|', '?']
5.编写一个画圆的函数
代码如下:
def cycle_picture():
    fig = plt.figure(figsize=(8, 8), dpi=100)
    ax = fig.add_subplot(111)
    theta = np.arange(0, 2 * np.pi, 0.01)
    x = 5 + 5.5 * np.cos(theta)
    y = 4 + 4.5 * np.sin(theta)
    # plt.vlines(np.arange(-0.5, 11, 1), -0.5, 8.5, linestyles='--')
    # plt.hlines(np.arange(-0.5, 9, 1), -0.5, 10.5)
    plt.plot(x, y, color='Black')
    ax.xaxis.set_ticks_position('top')
    plt.xticks(np.arange(-1, 12, 1))
    plt.yticks(np.arange(-1, 9, 1))
    ax.invert_yaxis()
    # plt.show()
    return ax
6.编写一个绘制FBC的函数
代码如下:
def FBC_draw(die_X, die_Y, list_FBC_temp, lot, wafer, list_FBC_item, local_Path):
    color_dict = {'1': '#00FF00', '2': '#32CD32', '3': '#90EE90', '4': '#F0E68C', '5': '#FFFF00', '6': '#FFA500',
                  '7': '#FF8C00', '8': '#FF7F50', '9': '#FF4500', '10': '#FF6347', '11': '#CD5C5C', '12': 'FF0000',
                  '13': '#8B0000'}

    ax = cycle_picture()

    for X, Y, FBC_v in zip(die_X, die_Y, list_FBC_temp):

        # 以下if结构中用FBC_v的大小来衡量每个die该赋的颜色, 文字, 以及文字大致居中时所需的X轴的坐标偏移量
        if FBC_v >= 268435456:
            temp_pv = round(FBC_v / 1024 / 1024, 1)
            color = '12'
            pv = str(temp_pv) + 'M'
            shift_v = 0.4

        elif 67108864 <= FBC_v < 268435456:
            temp_pv = round(FBC_v / 1024 / 1024, 1)
            color = '12'
            pv = str(temp_pv) + 'M'
            shift_v = 0.4

        elif 8388608 <= FBC_v < 67108864:
            temp_pv = round(FBC_v / 1024 / 1024, 1)
            color = '9'
            pv = str(temp_pv) + 'M'
            shift_v = 0.4

        elif 2097152 <= FBC_v < 8388608:
            temp_pv = round(FBC_v / 1024 / 1024, 1)
            color = '9'
            pv = str(temp_pv) + 'M'
            shift_v = 0.3

        elif 1048576 <= FBC_v < 2097152:
            temp_pv = round(FBC_v / 1024 / 1024, 1)
            color = '5'
            pv = str(temp_pv) + 'M'
            shift_v = 0.2

        elif 524288 <= FBC_v < 1048576:
            temp_pv = round(FBC_v / 1024 / 1024, 1)
            color = '5'
            pv = str(temp_pv) + 'M'
            shift_v = 0.2

        elif 104858 <= FBC_v < 524288:
            temp_pv = round(FBC_v / 1024 / 1024, 1)
            color = '4'
            pv = str(temp_pv) + 'M'
            shift_v = 0.2

        elif 1000 <= FBC_v < 104858:
            temp_pv = round(FBC_v / 1024, 1)
            color = '4'
            pv = str(temp_pv) + 'K'
            shift_v = 0.4

        elif 100 <= FBC_v < 1000:
            pv = FBC_v
            color = '4'
            shift_v = 0.3

        elif 50 <= FBC_v < 100:
            pv = FBC_v
            color = '3'
            shift_v = 0.2

        elif 10 <= FBC_v < 50:
            pv = FBC_v
            color = '3'
            shift_v = 0.2

        elif 0 < FBC_v < 10:
            pv = FBC_v
            color = '3'
            shift_v = 0.1

        elif FBC_v == 0:
            pv = FBC_v
            color = '1'
            shift_v = 0.1

        else:
            pv = FBC_v
            color = '12'
            shift_v = 0.1

        # 画出对应的die的形状Rectangle, 透明度alpha, 表面填充颜色, 边缘线条颜色, 线宽
        ax.add_patch(patches.Rectangle([X - 0.5, Y - 0.5], 1, 1, alpha=0.8, facecolor=color_dict[color], edgecolor='k', linewidth=2))

        # 画出每个die上的文字, 即需要显示的Fail bit count的大小
        plt.text(X - shift_v, Y + 0.08, pv, fontsize=12)

    for abnormal_character in abnormal_character_set:
        list_FBC_item = str(list_FBC_item).replace(abnormal_character, ' ')
    # 画出每片Wafer的标题
    plt.text(1, -0.77, str(lot) + '_W' + str(wafer) + '_' + str(list_FBC_item) + '_FBC_Map', size=14)
    # 调整subplot的参数
    plt.subplots_adjust(top=0.95, bottom=0, left=0, right=1, hspace=0, wspace=0)
    # 保存画好的FBC_Map图, bbox_inches='tight'以紧凑型保存, 并格式化命名
    plt.savefig(local_Path + '/' + str(lot) + '_W' + str(wafer) + '_' + str(list_FBC_item) + '_FBC_Map.jpg', bbox_inches='tight')
    # ion函数开始matplotlib的交互模式, 即遇到plt.show()函数时会继续执行
    # plt.ion()
    # plt.show()

    plt.close()
7.编写一个绘制ISB的函数
代码如下:
def ISB_draw(die_X, die_Y, list_Isb_temp, lot, wafer, list_Isb_item, local_Path):
    color_dict = {'1': '#00FF00', '2': '#32CD32', '3': '#90EE90', '4': '#F0E68C', '5': '#FFFF00', '6': '#FFA500',
                  '7': '#FF8C00', '8': '#FF7F50', '9': '#FF4500', '10': '#FF6347', '11': '#CD5C5C', '12': 'FF0000',
                  '13': '#8B0000'}

    ax = cycle_picture()

    for X, Y, ISB_v in zip(die_X, die_Y, list_Isb_temp):

        pv = abs(float(ISB_v))
        if 200 <= pv < 999999:
            # pv = str(round(pv / 1000, 2)) + 'K' if pv >= 1000 else round(pv, 1)
            # pv = round(pv, 1)
            pv = round(pv, 2)
            para_v = '4'
            shift_v = 0.4

        elif 150 <= pv < 200:
            pv = round(pv, 2)
            para_v = '4'
            shift_v = 0.4

        elif 100 <= pv < 150:
            pv = round(pv, 2)
            para_v = '4'
            shift_v = 0.4

        elif 80 <= pv < 100:
            pv = round(pv, 2)
            para_v = '4'
            shift_v = 0.3

        elif 50 <= pv < 80:
            pv = round(pv, 2)
            para_v = '4'
            shift_v = 0.25

        elif 30 <= pv < 50:
            pv = round(pv, 2)
            para_v = '4'
            shift_v = 0.3

        elif 10 <= pv < 30:
            pv = round(pv, 2)
            para_v = '3'
            shift_v = 0.3

        elif 0 <= pv < 10:
            pv = round(pv, 2)
            para_v = '1'
            shift_v = 0.2

        else:
            pv = round(pv, 2)
            para_v = '13'
            shift_v = 0.2

        ax.add_patch(patches.Rectangle([X - 0.5, Y - 0.5], 1, 1, alpha=0.8, facecolor=color_dict[para_v], edgecolor='k',
                                       linewidth=2))

        # 画出每个die上的文字, 即需要显示的Fail bit count的大小
        plt.text(X - shift_v, Y + 0.08, pv, fontsize=10)

    for abnormal_character in abnormal_character_set:
        list_Isb_item = str(list_Isb_item).replace(abnormal_character, ' ')
    plt.text(1, -0.77, str(lot) + '_W' + str(wafer) + '_' + str(list_Isb_item) + '_Map', size=14)
    plt.subplots_adjust(top=0.95, bottom=0, left=0, right=1, hspace=0, wspace=0)
    plt.savefig(local_Path + '/' + str(lot) + '_W' + str(wafer) + '_' + str(list_Isb_item) + '_Map.jpg', bbox_inches='tight')
    # plt.ion()
    # plt.pause()
    # plt.show()
    plt.close()
8.编写一个绘制Bin的函数
代码如下:
def Bin_draw(die_X, die_Y, bin, lot, wafer, local_Path):
    ax = cycle_picture()
    color_dict = {1: '#00FF00', 2: '#FF0000', 4: '#800000', 7: '#FFA500', 8: '#FF4500', 9: '#FFFF00',
                  10: '#7B68EE', 11: '#800080', 12: '#008080', 13: '#F08080', 14: '#BC8F8F', 15: '#CD5C5C',
                  16: '#87CEFA', 17: '#D4F2E7', 30: '#DA70D6', 31: '#9932CC', 32: '#0000FF', 36: '#FF00FF',
                  40: '#00FFFF', 44: '#1E90FF', 48: '#FF69B4', 49: '#FF6347', 66: '#FF69B4'}
    for X, Y, bin_v in zip(die_X, die_Y, bin):

        # 若First Fail Bin 不在color_dict的键值中, 则一律将其颜色赋值为color_dict中键值42的颜色值
        if bin_v in color_dict.keys():
            bin_v_index = bin_v
        else:
            bin_v_index = 66
        ax.add_patch(patches.Rectangle([X - 0.5, Y - 0.5], 1, 1, alpha=0.8, facecolor=color_dict[bin_v_index], edgecolor='k', linewidth=2))

        shift_v = 0.08 if len(str(bin_v)) == 1 else 0.2
        plt.text(X - shift_v, Y + 0.08, bin_v, fontsize=18)

    # 画图例
    legend = [[1, 2, 4, 7, 8, 9, 10, 11, 12, 13, 14, 15, 16, 17, 30, 31, 32, 36, 40, 44, 48, 49, 66]]
    colcolor = ['#00FF00', '#FF0000', '#800000', '#FFA500', '#FF4500', '#FFFF00', '#7B68EE', '#800080', '#008080',
                '#F08080', '#BC8F8F', '#CD5C5C', '#87CEFA', '#D4F2E7', '#DA70D6', '#9932CC', '#0000FF', '#FF00FF',
                '#00FFFF', '#1E90EF', '#FF69B4', '#FF6347', '#FF69B4']
    plt.table(loc='bottom', cellText=legend, cellLoc='center', colColours=colcolor, rowLabels=['Bin'])

    # 画标题
    plt.text(3.5, -0.77, str(lot) + '_W' + str(wafer) + '_Bin_Map', size=14)

    plt.subplots_adjust(top=0.95, bottom=0, left=0, right=1, hspace=0, wspace=0)
    plt.savefig(local_Path + '/' + str(lot) + '_W' + str(wafer) + '_Bin_Map.jpg', bbox_inches='tight')
    # plt.ion()
    # plt.show()
    # plt.pause()
    plt.close()
9.编写主体main函数
代码如下:
if __name__ == '__main__':
    print('程序正在运行, 请稍等...')
    count = 1
    for file in file_lists:
        print('=' * 30)
        print('正在处理第{}/{}个xlsx文件...'.format(count, len(file_lists)))
        ######################################################################
        ######################################################################
        # 清洗.xlsx数据
        df_dict = pd.read_excel(file, sheet_name=None)
        sheet_name_list = list(df_dict)
        # print('$$$sheet_name_list:', sheet_name_list)
        sheet_name_sel_list = []
        for sheet_name in sheet_name_list:
            if re.match(r'.*STDF.*', sheet_name, re.I):
                sheet_name_sel = re.match(r'.*STDF.*', sheet_name, re.I)
                sheet_name_sel_list.append(sheet_name_sel.group())
        # print('$$$sheet_name_sel_list:', sheet_name_sel_list)
        ######################################################################
        # 先提取共通的信息['lot_id', 'wf_id', 'die_x', 'die_y', 'SBIN_NUM']
        df_common_sel = df_dict[sheet_name_sel_list[0]]
        df_common = df_common_sel[column_common]
        # print('$$$df_common:', df_common)
        ######################################################################
        # 再提取非共通的信息['Istandby:VDD[1]', 'Istandby:VDDI[1]', 'Istandby:VDD_SRAM[1]', 'Istandby:VDDIO[1]',
        #  'Scan_HV', 'Scan_MV', 'Scan_LV', 'M6N_HV', 'M6N_MV', 'M6N_LV', 'Data_Retention_0', 'Data_Retention_1']
        column_private_dict = {}
        for sheet_name_var in sheet_name_sel_list:
            df_private_sel = df_dict[sheet_name_var]
            column_list = list(df_private_sel)
            for cols in column_list:
                if re.match(r'.*Istandby:VDD\[1]', cols, re.I):
                    column_private_dict.setdefault(sheet_name_var, []).append(cols)
                elif re.match(r'.*Istandby:VDDI\[1]', cols, re.I):
                    column_private_dict.setdefault(sheet_name_var, []).append(cols)
                elif re.match(r'.*Istandby:VDD_SRAM\[1]', cols, re.I):
                    column_private_dict.setdefault(sheet_name_var, []).append(cols)
                elif re.match(r'.*Istandby:VDDIO\[1]', cols, re.I):
                    column_private_dict.setdefault(sheet_name_var, []).append(cols)
                elif re.match(r'.*Scan_HV.*', cols, re.I):
                    column_private_dict.setdefault(sheet_name_var, []).append(cols)
                elif re.match(r'.*Scan_MV.*', cols, re.I):
                    column_private_dict.setdefault(sheet_name_var, []).append(cols)
                elif re.match(r'.*Scan_LV.*', cols, re.I):
                    column_private_dict.setdefault(sheet_name_var, []).append(cols)
                elif re.match(r'.*M6N_HV.*', cols, re.I):
                    column_private_dict.setdefault(sheet_name_var, []).append(cols)
                elif re.match(r'.*M6N_MV.*', cols, re.I):
                    column_private_dict.setdefault(sheet_name_var, []).append(cols)
                elif re.match(r'.*M6N_LV.*', cols, re.I):
                    column_private_dict.setdefault(sheet_name_var, []).append(cols)
                elif re.match(r'.*Data_Retention_0.*', cols, re.I):
                    column_private_dict.setdefault(sheet_name_var, []).append(cols)
                elif re.match(r'.*Data_Retention_1.*', cols, re.I):
                    column_private_dict.setdefault(sheet_name_var, []).append(cols)
        # print('$$$column_private_dict:', column_private_dict)
        num = 1
        for key in list(column_private_dict):
            df_tmp = df_dict[key][column_private_dict[key]]
            if num == 1:
                df_concat = pd.concat([df_common, df_tmp], axis=1)
            else:
                df_concat = pd.concat([df_concat, df_tmp], axis=1)
            num += 1
        # print('$$$df_concat:', df_concat)
        # print('$$$list(df_concat):', list(df_concat))

        Lot_ID = df_concat['lot_id'][0]
        Wafer_ID = df_concat['wf_id'][0]
        # VDDIO = df_concat['0:Istandby:VDDIO[1]']
        # print('$$$VDDIO:', VDDIO)
        df_concat.set_index('lot_id', inplace=True)

        path_str = ''
        if len(str(Wafer_ID)) == 1:
            path_str = '_W0'
        elif len(str(Wafer_ID)) == 2:
            path_str = '_W'

        output_path = path_pardir + '/Output/' + str(Lot_ID) + path_str + str(Wafer_ID) + '.xlsx'

        df_concat.to_excel(output_path)
        ######################################################################
        ######################################################################
        # 设置清洗后的表格的内部格式
        wb = openpyxl.load_workbook(output_path)
        ws = wb.active

        # 冻结窗口
        ws.freeze_panes = 'F2'

        # 字体微软雅黑, 加粗
        font = openpyxl.styles.Font('微软雅黑', bold=True)
        # 填充色为深橙色FF8C00
        fill = openpyxl.styles.PatternFill(fill_type='solid', start_color='FF8C00')

        # 计算每列最大宽度, 并存储在列表col_widths中
        col_widths = []
        for i in range(1, ws.max_column + 1):
            # 定义初始列宽col_width, 并在每个行循环完成后重置
            col_width = 1
            # 从第二行开始, 因为第一行为列标签, 即不计算第一行的列标签的宽度, 后面让其自动换行即可
            for j in range(2, ws.max_row + 1):
                cell_value = ws.cell(row=j, column=i).value
                # 中文占用多个字节, 需要分开处理
                if isinstance(cell_value, str):
                    # gbk解码一个中文两字节, utf-8一个中文三字节, gbk合适
                    col_width_real = len(cell_value.encode('gbk'))
                else:
                    col_width_real = len(str(cell_value))
                if col_width < col_width_real:
                    col_width = col_width_real
            col_widths.append(col_width)

        # 设置列宽
        for i in range(1, ws.max_column + 1):
            # 将数字转化为列名, 26个字母以内也可以用[chr(i).upper() for i in range(97, 123)], 不用导入模块
            col_name = get_column_letter(i)
            # 设置列宽, 一般加两个字节宽度, 可以根据实际情况灵活调整
            ws.column_dimensions[col_name].width = col_widths[i - 1] + 6

        # 设置第一行的单元格格式
        for i in range(1, ws.max_column + 1):
            # 设置第一行的单元格为自动换行, 水平居中, 垂直居中
            ws.cell(1, i).alignment = openpyxl.styles.Alignment(horizontal='center', vertical='center', wrap_text=True)
            # 设置第一行的单元格字体为微软雅黑, 加粗
            ws.cell(1, i).font = font
            # 设置第一行的单元格填充颜色为深橙色FF8C00
            ws.cell(1, i).fill = fill

        wb.save(output_path)
        print('第{}/{}个xlsx文件处理完毕!'.format(count, len(file_lists)))
        ######################################################################
        ######################################################################
        # 画Map
        print('开始输出第{}/{}个xlsx文件的Map...'.format(count, len(file_lists)))
        List_Isb_sel = []
        List_FBC_sel = []

        # 获取当前系统时间, 格式为年_月_日_时_分_秒, 把系统时间添加到文件夹的命名中, 以避免文件夹重复且方便归档记录
        Nowtime = dt.datetime.now().strftime('%Y_%m_%d_%H_%M_%S')
        # 创建文件夹, 使每片wafer的数据都单独有一个文件夹存放
        local_path = path_pardir + '/Output/' + str(Lot_ID) + path_str + str(Wafer_ID) + '_' + Nowtime
        os.makedirs(local_path)

        Die_X = df_concat['die_x'].tolist()
        Die_Y = df_concat['die_y'].tolist()
        Bin = df_concat['SBIN_NUM'].tolist()
        # 获取df_concat的列标签
        col_label = df_concat.columns.values.tolist()
        # print(col_label)
        # print(type(col_label))
        for s in col_label:
            if re.match(r'.*Istandby.*', s, re.I):
                List_Isb_sel.append(s)
            elif re.match(r'.*((Scan)|(M6N)|(Data_Retention)).*', s, re.I):
                List_FBC_sel.append(s)

        for i in range(len(Bin)):
            Bin_draw(Die_X, Die_Y, Bin, Lot_ID, Wafer_ID, local_path)

        for i in range(len(List_Isb_sel)):
            List_Isb_item = List_Isb_sel[i]
            List_Isb_temp = df_concat[List_Isb_sel[i]].tolist()
            ISB_draw(Die_X, Die_Y, List_Isb_temp, Lot_ID, Wafer_ID, List_Isb_item, local_path)

        for i in range(len(List_FBC_sel)):
            List_FBC_item = List_FBC_sel[i]
            List_FBC_temp = df_concat[List_FBC_sel[i]].tolist()
            # print(List_FBC_temp)
            FBC_draw(Die_X, Die_Y, List_FBC_temp, Lot_ID, Wafer_ID, List_FBC_item, local_path)
        print('第{}/{}个xlsx文件的Map输出完毕!'.format(count, len(file_lists)))
        ######################################################################
        ######################################################################
        count += 1
    print('程序运行完毕!')
    print('=' * 30)
10.完整脚本如下
代码如下:
import numpy as np
import pandas as pd
import matplotlib.patches as patches
import matplotlib.pyplot as plt
import datetime as dt
import openpyxl
from openpyxl.utils import get_column_letter
import re
import os
import glob
import warnings
warnings.filterwarnings('ignore')

pd.options.display.max_columns = None
global df_concat


# 获取当前脚本文件所在目录
path_current = os.getcwd()
# 获取当前脚本文件所在目录的上一级目录
path_pardir = os.path.dirname(path_current)
print('$$$path_pardir:', path_pardir)
file_lists = glob.glob(path_pardir + '/Output/*.xlsx')
print('$$$file_lists:', file_lists)


# 先定义好需要提取的有效信息的列名
column_common = ['lot_id', 'wf_id', 'die_x', 'die_y', 'SBIN_NUM']
# column_private = ['Istandby:VDD[1]', 'Istandby:VDDI[1]', 'Istandby:VDD_SRAM[1]', 'Istandby:VDDIO[1]',
# 'Scan_HV', 'Scan_MV', 'Scan_LV', 'M6N_HV', 'M6N_MV', 'M6N_LV', 'Data_Retention_0', 'Data_Retention_1']


abnormal_character_set = ['/', '\\', ':', '*', '"', '<', '>', '|', '?']


def cycle_picture():
    fig = plt.figure(figsize=(8, 8), dpi=100)
    ax = fig.add_subplot(111)
    theta = np.arange(0, 2 * np.pi, 0.01)
    x = 5 + 5.5 * np.cos(theta)
    y = 4 + 4.5 * np.sin(theta)
    # plt.vlines(np.arange(-0.5, 11, 1), -0.5, 8.5, linestyles='--')
    # plt.hlines(np.arange(-0.5, 9, 1), -0.5, 10.5)
    plt.plot(x, y, color='Black')
    ax.xaxis.set_ticks_position('top')
    plt.xticks(np.arange(-1, 12, 1))
    plt.yticks(np.arange(-1, 9, 1))
    ax.invert_yaxis()
    # plt.show()
    return ax


def FBC_draw(die_X, die_Y, list_FBC_temp, lot, wafer, list_FBC_item, local_Path):
    color_dict = {'1': '#00FF00', '2': '#32CD32', '3': '#90EE90', '4': '#F0E68C', '5': '#FFFF00', '6': '#FFA500',
                  '7': '#FF8C00', '8': '#FF7F50', '9': '#FF4500', '10': '#FF6347', '11': '#CD5C5C', '12': 'FF0000',
                  '13': '#8B0000'}

    ax = cycle_picture()

    for X, Y, FBC_v in zip(die_X, die_Y, list_FBC_temp):

        # 以下if结构中用FBC_v的大小来衡量每个die该赋的颜色, 文字, 以及文字大致居中时所需的X轴的坐标偏移量
        if FBC_v >= 268435456:
            temp_pv = round(FBC_v / 1024 / 1024, 1)
            color = '12'
            pv = str(temp_pv) + 'M'
            shift_v = 0.4

        elif 67108864 <= FBC_v < 268435456:
            temp_pv = round(FBC_v / 1024 / 1024, 1)
            color = '12'
            pv = str(temp_pv) + 'M'
            shift_v = 0.4

        elif 8388608 <= FBC_v < 67108864:
            temp_pv = round(FBC_v / 1024 / 1024, 1)
            color = '9'
            pv = str(temp_pv) + 'M'
            shift_v = 0.4

        elif 2097152 <= FBC_v < 8388608:
            temp_pv = round(FBC_v / 1024 / 1024, 1)
            color = '9'
            pv = str(temp_pv) + 'M'
            shift_v = 0.3

        elif 1048576 <= FBC_v < 2097152:
            temp_pv = round(FBC_v / 1024 / 1024, 1)
            color = '5'
            pv = str(temp_pv) + 'M'
            shift_v = 0.2

        elif 524288 <= FBC_v < 1048576:
            temp_pv = round(FBC_v / 1024 / 1024, 1)
            color = '5'
            pv = str(temp_pv) + 'M'
            shift_v = 0.2

        elif 104858 <= FBC_v < 524288:
            temp_pv = round(FBC_v / 1024 / 1024, 1)
            color = '4'
            pv = str(temp_pv) + 'M'
            shift_v = 0.2

        elif 1000 <= FBC_v < 104858:
            temp_pv = round(FBC_v / 1024, 1)
            color = '4'
            pv = str(temp_pv) + 'K'
            shift_v = 0.4

        elif 100 <= FBC_v < 1000:
            pv = FBC_v
            color = '4'
            shift_v = 0.3

        elif 50 <= FBC_v < 100:
            pv = FBC_v
            color = '3'
            shift_v = 0.2

        elif 10 <= FBC_v < 50:
            pv = FBC_v
            color = '3'
            shift_v = 0.2

        elif 0 < FBC_v < 10:
            pv = FBC_v
            color = '3'
            shift_v = 0.1

        elif FBC_v == 0:
            pv = FBC_v
            color = '1'
            shift_v = 0.1

        else:
            pv = FBC_v
            color = '12'
            shift_v = 0.1

        # 画出对应的die的形状Rectangle, 透明度alpha, 表面填充颜色, 边缘线条颜色, 线宽
        ax.add_patch(patches.Rectangle([X - 0.5, Y - 0.5], 1, 1, alpha=0.8, facecolor=color_dict[color], edgecolor='k', linewidth=2))

        # 画出每个die上的文字, 即需要显示的Fail bit count的大小
        plt.text(X - shift_v, Y + 0.08, pv, fontsize=12)

    for abnormal_character in abnormal_character_set:
        list_FBC_item = str(list_FBC_item).replace(abnormal_character, ' ')
    # 画出每片Wafer的标题
    plt.text(1, -0.77, str(lot) + '_W' + str(wafer) + '_' + str(list_FBC_item) + '_FBC_Map', size=14)
    # 调整subplot的参数
    plt.subplots_adjust(top=0.95, bottom=0, left=0, right=1, hspace=0, wspace=0)
    # 保存画好的FBC_Map图, bbox_inches='tight'以紧凑型保存, 并格式化命名
    plt.savefig(local_Path + '/' + str(lot) + '_W' + str(wafer) + '_' + str(list_FBC_item) + '_FBC_Map.jpg', bbox_inches='tight')
    # ion函数开始matplotlib的交互模式, 即遇到plt.show()函数时会继续执行
    # plt.ion()
    # plt.show()

    plt.close()


def ISB_draw(die_X, die_Y, list_Isb_temp, lot, wafer, list_Isb_item, local_Path):
    color_dict = {'1': '#00FF00', '2': '#32CD32', '3': '#90EE90', '4': '#F0E68C', '5': '#FFFF00', '6': '#FFA500',
                  '7': '#FF8C00', '8': '#FF7F50', '9': '#FF4500', '10': '#FF6347', '11': '#CD5C5C', '12': 'FF0000',
                  '13': '#8B0000'}

    ax = cycle_picture()

    for X, Y, ISB_v in zip(die_X, die_Y, list_Isb_temp):

        pv = abs(float(ISB_v))
        if 200 <= pv < 999999:
            # pv = str(round(pv / 1000, 2)) + 'K' if pv >= 1000 else round(pv, 1)
            # pv = round(pv, 1)
            pv = round(pv, 2)
            para_v = '4'
            shift_v = 0.4

        elif 150 <= pv < 200:
            pv = round(pv, 2)
            para_v = '4'
            shift_v = 0.4

        elif 100 <= pv < 150:
            pv = round(pv, 2)
            para_v = '4'
            shift_v = 0.4

        elif 80 <= pv < 100:
            pv = round(pv, 2)
            para_v = '4'
            shift_v = 0.3

        elif 50 <= pv < 80:
            pv = round(pv, 2)
            para_v = '4'
            shift_v = 0.25

        elif 30 <= pv < 50:
            pv = round(pv, 2)
            para_v = '4'
            shift_v = 0.3

        elif 10 <= pv < 30:
            pv = round(pv, 2)
            para_v = '3'
            shift_v = 0.3

        elif 0 <= pv < 10:
            pv = round(pv, 2)
            para_v = '1'
            shift_v = 0.2

        else:
            pv = round(pv, 2)
            para_v = '13'
            shift_v = 0.2

        ax.add_patch(patches.Rectangle([X - 0.5, Y - 0.5], 1, 1, alpha=0.8, facecolor=color_dict[para_v], edgecolor='k',
                                       linewidth=2))

        # 画出每个die上的文字, 即需要显示的Fail bit count的大小
        plt.text(X - shift_v, Y + 0.08, pv, fontsize=10)

    for abnormal_character in abnormal_character_set:
        list_Isb_item = str(list_Isb_item).replace(abnormal_character, ' ')
    plt.text(1, -0.77, str(lot) + '_W' + str(wafer) + '_' + str(list_Isb_item) + '_Map', size=14)
    plt.subplots_adjust(top=0.95, bottom=0, left=0, right=1, hspace=0, wspace=0)
    plt.savefig(local_Path + '/' + str(lot) + '_W' + str(wafer) + '_' + str(list_Isb_item) + '_Map.jpg', bbox_inches='tight')
    # plt.ion()
    # plt.pause()
    # plt.show()
    plt.close()


def Bin_draw(die_X, die_Y, bin, lot, wafer, local_Path):
    ax = cycle_picture()
    color_dict = {1: '#00FF00', 2: '#FF0000', 4: '#800000', 7: '#FFA500', 8: '#FF4500', 9: '#FFFF00',
                  10: '#7B68EE', 11: '#800080', 12: '#008080', 13: '#F08080', 14: '#BC8F8F', 15: '#CD5C5C',
                  16: '#87CEFA', 17: '#D4F2E7', 30: '#DA70D6', 31: '#9932CC', 32: '#0000FF', 36: '#FF00FF',
                  40: '#00FFFF', 44: '#1E90FF', 48: '#FF69B4', 49: '#FF6347', 66: '#FF69B4'}
    for X, Y, bin_v in zip(die_X, die_Y, bin):

        # 若First Fail Bin 不在color_dict的键值中, 则一律将其颜色赋值为color_dict中键值42的颜色值
        if bin_v in color_dict.keys():
            bin_v_index = bin_v
        else:
            bin_v_index = 66
        ax.add_patch(patches.Rectangle([X - 0.5, Y - 0.5], 1, 1, alpha=0.8, facecolor=color_dict[bin_v_index], edgecolor='k', linewidth=2))

        shift_v = 0.08 if len(str(bin_v)) == 1 else 0.2
        plt.text(X - shift_v, Y + 0.08, bin_v, fontsize=18)

    # 画图例
    legend = [[1, 2, 4, 7, 8, 9, 10, 11, 12, 13, 14, 15, 16, 17, 30, 31, 32, 36, 40, 44, 48, 49, 66]]
    colcolor = ['#00FF00', '#FF0000', '#800000', '#FFA500', '#FF4500', '#FFFF00', '#7B68EE', '#800080', '#008080',
                '#F08080', '#BC8F8F', '#CD5C5C', '#87CEFA', '#D4F2E7', '#DA70D6', '#9932CC', '#0000FF', '#FF00FF',
                '#00FFFF', '#1E90EF', '#FF69B4', '#FF6347', '#FF69B4']
    plt.table(loc='bottom', cellText=legend, cellLoc='center', colColours=colcolor, rowLabels=['Bin'])

    # 画标题
    plt.text(3.5, -0.77, str(lot) + '_W' + str(wafer) + '_Bin_Map', size=14)

    plt.subplots_adjust(top=0.95, bottom=0, left=0, right=1, hspace=0, wspace=0)
    plt.savefig(local_Path + '/' + str(lot) + '_W' + str(wafer) + '_Bin_Map.jpg', bbox_inches='tight')
    # plt.ion()
    # plt.show()
    # plt.pause()
    plt.close()


if __name__ == '__main__':
    print('程序正在运行, 请稍等...')
    count = 1
    for file in file_lists:
        print('=' * 30)
        print('正在处理第{}/{}个xlsx文件...'.format(count, len(file_lists)))
        ######################################################################
        ######################################################################
        # 清洗.xlsx数据
        df_dict = pd.read_excel(file, sheet_name=None)
        sheet_name_list = list(df_dict)
        # print('$$$sheet_name_list:', sheet_name_list)
        sheet_name_sel_list = []
        for sheet_name in sheet_name_list:
            if re.match(r'.*STDF.*', sheet_name, re.I):
                sheet_name_sel = re.match(r'.*STDF.*', sheet_name, re.I)
                sheet_name_sel_list.append(sheet_name_sel.group())
        # print('$$$sheet_name_sel_list:', sheet_name_sel_list)
        ######################################################################
        # 先提取共通的信息['lot_id', 'wf_id', 'die_x', 'die_y', 'SBIN_NUM']
        df_common_sel = df_dict[sheet_name_sel_list[0]]
        df_common = df_common_sel[column_common]
        # print('$$$df_common:', df_common)
        ######################################################################
        # 再提取非共通的信息['Istandby:VDD[1]', 'Istandby:VDDI[1]', 'Istandby:VDD_SRAM[1]', 'Istandby:VDDIO[1]',
        #  'Scan_HV', 'Scan_MV', 'Scan_LV', 'M6N_HV', 'M6N_MV', 'M6N_LV', 'Data_Retention_0', 'Data_Retention_1']
        column_private_dict = {}
        for sheet_name_var in sheet_name_sel_list:
            df_private_sel = df_dict[sheet_name_var]
            column_list = list(df_private_sel)
            for cols in column_list:
                if re.match(r'.*Istandby:VDD\[1]', cols, re.I):
                    column_private_dict.setdefault(sheet_name_var, []).append(cols)
                elif re.match(r'.*Istandby:VDDI\[1]', cols, re.I):
                    column_private_dict.setdefault(sheet_name_var, []).append(cols)
                elif re.match(r'.*Istandby:VDD_SRAM\[1]', cols, re.I):
                    column_private_dict.setdefault(sheet_name_var, []).append(cols)
                elif re.match(r'.*Istandby:VDDIO\[1]', cols, re.I):
                    column_private_dict.setdefault(sheet_name_var, []).append(cols)
                elif re.match(r'.*Scan_HV.*', cols, re.I):
                    column_private_dict.setdefault(sheet_name_var, []).append(cols)
                elif re.match(r'.*Scan_MV.*', cols, re.I):
                    column_private_dict.setdefault(sheet_name_var, []).append(cols)
                elif re.match(r'.*Scan_LV.*', cols, re.I):
                    column_private_dict.setdefault(sheet_name_var, []).append(cols)
                elif re.match(r'.*M6N_HV.*', cols, re.I):
                    column_private_dict.setdefault(sheet_name_var, []).append(cols)
                elif re.match(r'.*M6N_MV.*', cols, re.I):
                    column_private_dict.setdefault(sheet_name_var, []).append(cols)
                elif re.match(r'.*M6N_LV.*', cols, re.I):
                    column_private_dict.setdefault(sheet_name_var, []).append(cols)
                elif re.match(r'.*Data_Retention_0.*', cols, re.I):
                    column_private_dict.setdefault(sheet_name_var, []).append(cols)
                elif re.match(r'.*Data_Retention_1.*', cols, re.I):
                    column_private_dict.setdefault(sheet_name_var, []).append(cols)
        # print('$$$column_private_dict:', column_private_dict)
        num = 1
        for key in list(column_private_dict):
            df_tmp = df_dict[key][column_private_dict[key]]
            if num == 1:
                df_concat = pd.concat([df_common, df_tmp], axis=1)
            else:
                df_concat = pd.concat([df_concat, df_tmp], axis=1)
            num += 1
        # print('$$$df_concat:', df_concat)
        # print('$$$list(df_concat):', list(df_concat))

        Lot_ID = df_concat['lot_id'][0]
        Wafer_ID = df_concat['wf_id'][0]
        # VDDIO = df_concat['0:Istandby:VDDIO[1]']
        # print('$$$VDDIO:', VDDIO)
        df_concat.set_index('lot_id', inplace=True)

        path_str = ''
        if len(str(Wafer_ID)) == 1:
            path_str = '_W0'
        elif len(str(Wafer_ID)) == 2:
            path_str = '_W'

        output_path = path_pardir + '/Output/' + str(Lot_ID) + path_str + str(Wafer_ID) + '.xlsx'

        df_concat.to_excel(output_path)
        ######################################################################
        ######################################################################
        # 设置清洗后的表格的内部格式
        wb = openpyxl.load_workbook(output_path)
        ws = wb.active

        # 冻结窗口
        ws.freeze_panes = 'F2'

        # 字体微软雅黑, 加粗
        font = openpyxl.styles.Font('微软雅黑', bold=True)
        # 填充色为深橙色FF8C00
        fill = openpyxl.styles.PatternFill(fill_type='solid', start_color='FF8C00')

        # 计算每列最大宽度, 并存储在列表col_widths中
        col_widths = []
        for i in range(1, ws.max_column + 1):
            # 定义初始列宽col_width, 并在每个行循环完成后重置
            col_width = 1
            # 从第二行开始, 因为第一行为列标签, 即不计算第一行的列标签的宽度, 后面让其自动换行即可
            for j in range(2, ws.max_row + 1):
                cell_value = ws.cell(row=j, column=i).value
                # 中文占用多个字节, 需要分开处理
                if isinstance(cell_value, str):
                    # gbk解码一个中文两字节, utf-8一个中文三字节, gbk合适
                    col_width_real = len(cell_value.encode('gbk'))
                else:
                    col_width_real = len(str(cell_value))
                if col_width < col_width_real:
                    col_width = col_width_real
            col_widths.append(col_width)

        # 设置列宽
        for i in range(1, ws.max_column + 1):
            # 将数字转化为列名, 26个字母以内也可以用[chr(i).upper() for i in range(97, 123)], 不用导入模块
            col_name = get_column_letter(i)
            # 设置列宽, 一般加两个字节宽度, 可以根据实际情况灵活调整
            ws.column_dimensions[col_name].width = col_widths[i - 1] + 6

        # 设置第一行的单元格格式
        for i in range(1, ws.max_column + 1):
            # 设置第一行的单元格为自动换行, 水平居中, 垂直居中
            ws.cell(1, i).alignment = openpyxl.styles.Alignment(horizontal='center', vertical='center', wrap_text=True)
            # 设置第一行的单元格字体为微软雅黑, 加粗
            ws.cell(1, i).font = font
            # 设置第一行的单元格填充颜色为深橙色FF8C00
            ws.cell(1, i).fill = fill

        wb.save(output_path)
        print('第{}/{}个xlsx文件处理完毕!'.format(count, len(file_lists)))
        ######################################################################
        ######################################################################
        # 画Map
        print('开始输出第{}/{}个xlsx文件的Map...'.format(count, len(file_lists)))
        List_Isb_sel = []
        List_FBC_sel = []

        # 获取当前系统时间, 格式为年_月_日_时_分_秒, 把系统时间添加到文件夹的命名中, 以避免文件夹重复且方便归档记录
        Nowtime = dt.datetime.now().strftime('%Y_%m_%d_%H_%M_%S')
        # 创建文件夹, 使每片wafer的数据都单独有一个文件夹存放
        local_path = path_pardir + '/Output/' + str(Lot_ID) + path_str + str(Wafer_ID) + '_' + Nowtime
        os.makedirs(local_path)

        Die_X = df_concat['die_x'].tolist()
        Die_Y = df_concat['die_y'].tolist()
        Bin = df_concat['SBIN_NUM'].tolist()
        # 获取df_concat的列标签
        col_label = df_concat.columns.values.tolist()
        # print(col_label)
        # print(type(col_label))
        for s in col_label:
            if re.match(r'.*Istandby.*', s, re.I):
                List_Isb_sel.append(s)
            elif re.match(r'.*((Scan)|(M6N)|(Data_Retention)).*', s, re.I):
                List_FBC_sel.append(s)

        for i in range(len(Bin)):
            Bin_draw(Die_X, Die_Y, Bin, Lot_ID, Wafer_ID, local_path)

        for i in range(len(List_Isb_sel)):
            List_Isb_item = List_Isb_sel[i]
            List_Isb_temp = df_concat[List_Isb_sel[i]].tolist()
            ISB_draw(Die_X, Die_Y, List_Isb_temp, Lot_ID, Wafer_ID, List_Isb_item, local_path)

        for i in range(len(List_FBC_sel)):
            List_FBC_item = List_FBC_sel[i]
            List_FBC_temp = df_concat[List_FBC_sel[i]].tolist()
            # print(List_FBC_temp)
            FBC_draw(Die_X, Die_Y, List_FBC_temp, Lot_ID, Wafer_ID, List_FBC_item, local_path)
        print('第{}/{}个xlsx文件的Map输出完毕!'.format(count, len(file_lists)))
        ######################################################################
        ######################################################################
        count += 1
    print('程序运行完毕!')
    print('=' * 30)
四、需要注意的点
1.由于文件夹名或者文件名中不能有以下九种字符,所以在保存图片之前需要对文件名中的这些字符进行过滤剔除
代码如下:
    for abnormal_character in abnormal_character_set:
        list_FBC_item = str(list_FBC_item).replace(abnormal_character, ' ')
    for abnormal_character in abnormal_character_set:
        list_Isb_item = str(list_Isb_item).replace(abnormal_character, ' ')
2.由于我们直接利用pandas输出到excel文件中时,表格是没有任何格式设置的,如果我们希望看到格式比较规整的excel表格,就需要用下面这段代码进行格式设置(主要利用openpyxl进行格式化设置)
代码如下:
######################################################################
######################################################################
# 设置清洗后的表格的内部格式
wb = openpyxl.load_workbook(output_path)
ws = wb.active

# 冻结窗口
ws.freeze_panes = 'F2'

# 字体微软雅黑, 加粗
font = openpyxl.styles.Font('微软雅黑', bold=True)
# 填充色为深橙色FF8C00
fill = openpyxl.styles.PatternFill(fill_type='solid', start_color='FF8C00')

# 计算每列最大宽度, 并存储在列表col_widths中
col_widths = []
for i in range(1, ws.max_column + 1):
	# 定义初始列宽col_width, 并在每个行循环完成后重置
	col_width = 1
	# 从第二行开始, 因为第一行为列标签, 即不计算第一行的列标签的宽度, 后面让其自动换行即可
	for j in range(2, ws.max_row + 1):
		cell_value = ws.cell(row=j, column=i).value
		# 中文占用多个字节, 需要分开处理
		if isinstance(cell_value, str):
			# gbk解码一个中文两字节, utf-8一个中文三字节, gbk合适
			col_width_real = len(cell_value.encode('gbk'))
		else:
			col_width_real = len(str(cell_value))
		if col_width < col_width_real:
			col_width = col_width_real
	col_widths.append(col_width)

# 设置列宽
for i in range(1, ws.max_column + 1):
	# 将数字转化为列名, 26个字母以内也可以用[chr(i).upper() for i in range(97, 123)], 不用导入模块
	col_name = get_column_letter(i)
	# 设置列宽, 一般加两个字节宽度, 可以根据实际情况灵活调整
	ws.column_dimensions[col_name].width = col_widths[i - 1] + 6

# 设置第一行的单元格格式
for i in range(1, ws.max_column + 1):
	# 设置第一行的单元格为自动换行, 水平居中, 垂直居中
	ws.cell(1, i).alignment = openpyxl.styles.Alignment(horizontal='center', vertical='center', wrap_text=True)
	# 设置第一行的单元格字体为微软雅黑, 加粗
	ws.cell(1, i).font = font
	# 设置第一行的单元格填充颜色为深橙色FF8C00
	ws.cell(1, i).fill = fill

wb.save(output_path)
print('第{}/{}个xlsx文件处理完毕!'.format(count, len(file_lists)))
######################################################################
######################################################################
3.获取系统当前时间,把时间字符串添加到文件夹的命名中,这样可以避免多次运行程序导致文件夹重复,覆盖原有文件夹的问题
代码如下:
# 获取当前系统时间, 格式为年_月_日_时_分_秒, 把系统时间添加到文件夹的命名中, 以避免文件夹重复且方便归档记录
Nowtime = dt.datetime.now().strftime('%Y_%m_%d_%H_%M_%S')
# 创建文件夹, 使每片wafer的数据都单独有一个文件夹存放
local_path = path_pardir + '/Output/' + str(Lot_ID) + path_str + str(Wafer_ID) + '_' + Nowtime
os.makedirs(local_path)
五、总结
本文所要讲的内容就这些,主要讲了如何利用正则表达式re模块和pandas模块清洗数据混乱的表格.xlsx文件;然后讲了如何利用openpyxl对清洗后的表格进行单元格格式化设置,接着讲了如何利用matplotlib模块对清洗后的表格进行数据可视化分析。希望对大家学习数据清洗、数据分析有帮助。

永洪科技,致力于打造全球领先的数据技术厂商,具备从数据应用方案咨询、BI、AIGC智能分析、数字孪生、数据资产、数据治理、数据实施的端到端大数据价值服务能力。
更多推荐


 1
1 0
0- 0


 已为社区贡献2条内容

所有评论(0)